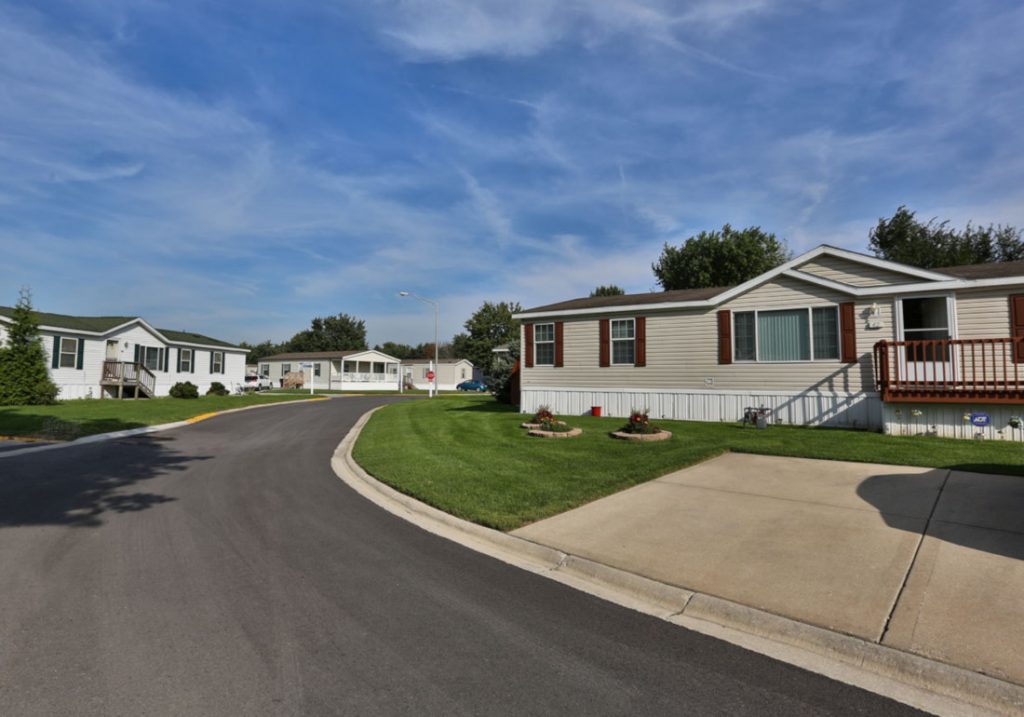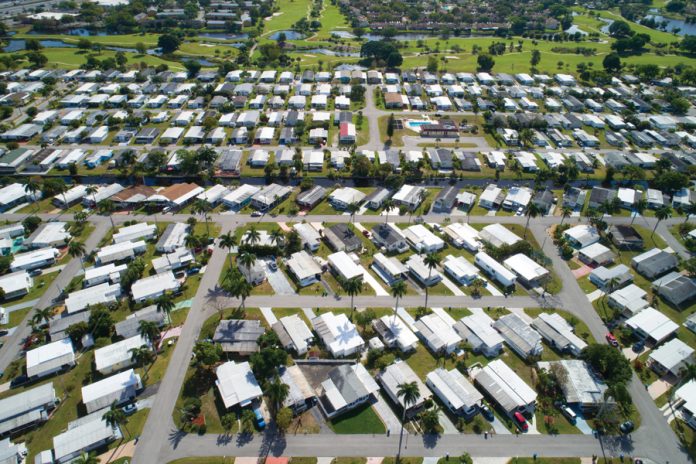
Over the last several years, the mobile home category has boomed. The convergence of multiple supply- and demand-side market conditions coincided with a historic generational shift to create an unprecedented sellers’ market. This seller’s market had extended beyond expectations and was long-believed to be in its eleventh inning.
Will coronavirus prompt a game-over call?
The Pre-Coronavirus Landscape
By supplementing available market intelligence with our own national data and empirical analysis we have created a moving picture of the community segment. Over the 2018-2019 period, our data shows strong demand for mobile home park communities. That demand continued to drive prices up and push cap rates down.
The market was hot
For the most part, larger parks in large MSAs were in the highest demand. Hot markets such as California, Arizona, and Florida had the greatest price gains. Cap rates in these markets approached 3% for group buys of larger parks in February of this year, while we were still seeing smaller deals in the 9% range. Our sales data shows an average cap rate reduction of approximately 38 basis points.
Occupancy good and improving
Our reports show an approximate 4.8% increase in occupancy over the last two years for the properties we were marketing. A broader view of the category at the market level revealed a slightly lower increase in occupancy but confirmed the upward trend.
According to MHInsider’s 2019 State of the Industry edition, national occupancy rates for manufactured home communities reached 93% for the 12-month period between May 2018 and May 2019.
All-ages communities came in at 91% while 55+ communities reported an average 96% occupancy rate. The data revealed an uptick of approximately 1% for the national metric over the same period. Breaking it down, all-ages communities registered an increase of 1.2%, while the 55+ communities gained of 0.5% in occupancy.
The occupancy metric is interesting because mobile home parks have historically been a multi-generational hold with limited change over the years.
As larger and more sophisticated groups have entered the market, we’ve seen a lot more streamlining and efficiency in the space both on the back and front end of the business. This increase in efficiency contributed to a reduction in vacancy rates particularly in the sunbelt.
Increasing curb appeal within the go-to-market trend helps push occupancy rates up. In addition, the national lack of affordable housing combined with more appealing models of manufactured homes has contributed to a boost.
Sales Volume at Historical Highs
 The big driver in the category has been the significant sales volume increase.
According to a recent Fannie Mae report, 2018 mobile home community sales volumes reached approximately $9.3 billion, highest since the end of the Great Recession in June 2009 — an important point we’ll revisit in the post-pandemic section.
The report notes much of the volume was driven by large transactions and private investors, including privately-owned companies with about 70% of the purchase volume.
In addition, institutional buyers accounted for 10% of the volume, but the top spot in acquisition share belonged to Fort Worth-based institutional fund TPG Capital with acquisitions of $387 million.
TGP was followed closely by Yes! Communities, a private REIT based in Denver with $376 million in acquisition volume. Internally, our empirical analysis reflects a similar pattern with approximately 75% of our sales going to private investors and groups that include privately-owned companies and/or developers.
Deal Velocity Acceleration
Other trends were in transaction velocity and market players. We see a marked decrease of approximately 26.6% in days on market. Much of this was due to the large number of buyers entering the market and the heightened interest in the category.
A higher number of buyers speeds up the process and increases the competition. For example, last year we averaged approximately 12 qualified offers a deal. This allowed us to find the right buyer, at the right price, much faster.
As a result, our internal velocity metric increased by approximately 100% year-over-year.
And then, coronavirus called a time-out.

The Post-Coronavirus Outlook
As we looked ahead to 2020, we saw a few trends developing and were on alert for other factors that could play a role.
What no one foresaw was a global pandemic.
Before the COVID-19 crisis, one of the biggest swaths of uncertainty was around the impact the election, politics, and fiscal policy could have on interest rates. Buyers had been on the favored side of rates.
Perhaps in anticipation of potential changes on the horizon or even the awareness of the seller market’s 11th inning feel, our information was showing an increase in sales volume.
Six weeks into the year, we had already produced 40% of our 2019 volume and we fully expected this rate of increase to continue with the potential that it would begin to level off toward the end of the year.
The New Challenges
Approximately a month into the crisis in the United States, the fundamental yet short-term challenges were:
-
Lack of financing options
The lack of financing options has already started and it is one of the biggest challenges we will encounter. Acquisitions of manufactured home communities are primarily financed by agencies such as Fannie or Freddie, banks, and the CMBS market.
The CMBS market is at a standstill and will remain so well into summer. Banks also hover on pause with stricter parameters for future deals and backing off ones in process.
The apparent outliers are Fannie and Freddie and their favorite child — affordable housing. Recent quotes from the agency are more favorable when compared to those given to multi-family. While agency financing typically calls for less flexible parameters, parks that qualify could jump ahead of the pack in deal velocity.
-
Bottlenecks across the board
With the country on pause, bottlenecks have formed across the transaction chain. This includes everything from financing and physical inspections to environmental studies and surveys.
As we move forward bottlenecks will ease but continue to create delays if more sporadically through the second quarter.
Collections, an area that was expected to be a bottleneck, has so far materialized smoother than anticipated. Owners we’ve spoken with reported better than expected collections for the months of April and May.
-
Uncertainty
In the face of uncertainty, people tend to wait. We sit squarely in the middle of this phase. We will see uncertainty get factored into deals across the spectrum higher rates and revised resident agreements. This uncertainty is expected to begin to clear out as we move through the rest of this quarter and into Q3 and Q4.
Perhaps our MVP and pinch hitter in this and any crisis is our affordable housing status. As affordable housing, we are recession-resistant and become a more attractive option during challenging economic periods.


