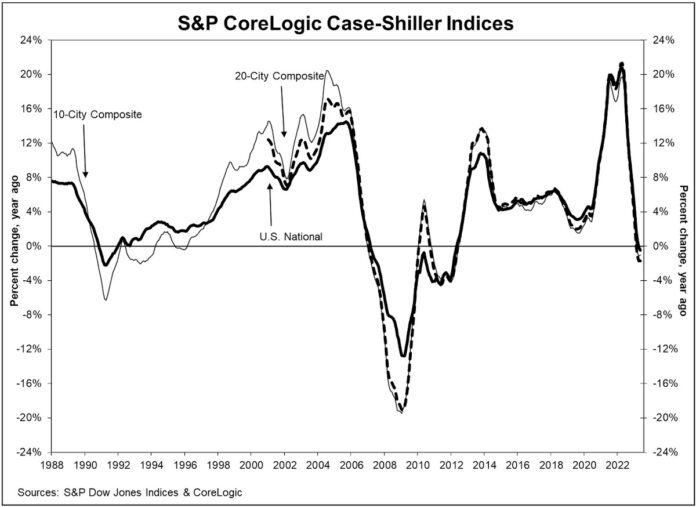
The S&P CoreLogic Case-Shiller U.S. National Home Price NSA Index reported a -0.5 percent annual decrease in May, down from -0.1 percent the previous month.
Chicago, Cleveland, and New York reported the highest year-over-year gains among the 20 cities in May.
At the other end of the scale, the worst performers continue to cluster near the Pacific coast, with Seattle prices down 11.3 percent, and San Francisco down 11 percent.
“The rally in U.S. home prices continued in May 2023,” S&P DJI Managing Director Craig J. Lazzara said. “Our National Composite rose by 1.2 percent in May, and now stands only 1 percent below its June 2022 peak. The 10- and 20-City Composites also rose in May, in both cases by 1.5 percent.
“Regional differences continue to be striking,” he said. “This month’s league table shows the ‘Revenge of the Rust Belt’,” Lazzara said. Chicago was up 4.6 percent, Cleveland up 3.9 percent, and New York up 3.5 percent.
S&P Dow Jones Indices provide index-based concepts, data, and research. It is the home of the S&P 500® and the Dow Jones Industrial Average®. Charles Dow invented the first index in 1884.
MHInsider is the leader in manufactured housing news and is a product of MHVillage, the top marketplace for manufactured homes.


