What Is The State of the Manufactured Housing Industry?
2026 Updated Industry Facts and Figures
This post highlights some of the top-line trends in the manufactured housing industry, updated on an annual basis each spring. Manufactured homes continue to be a crucial solution to the affordable housing crisis, filling the gap in the middle housing market for many customer segments. Based on the numbers in our 2026 “State of the Industry” report on manufactured housing trends and statistics, the industry continues to show positive signs of growth.
Competitive Advantage
What is the cost for a new manufactured home?
The average cost for a new manufactured home in 2025 was $115,557, up nearly 5.33 percent from the previous year. For a multi-section home, the average cost was $156,170, and the price of a new single-section home averaged $95,074. For an existing manufactured home, the average sale price in 2025 was $73,326, up 2.31 percent from the previous year.
What is the cost per square foot for manufactured homes?
The average cost per square foot for a new manufactured home is $101.20. For a multi-section home, the price per square foot averages $110.26 and the price per square foot of a single-section home averages $95.17.
Community Living
How many manufactured homes are there, and how many go to communities?
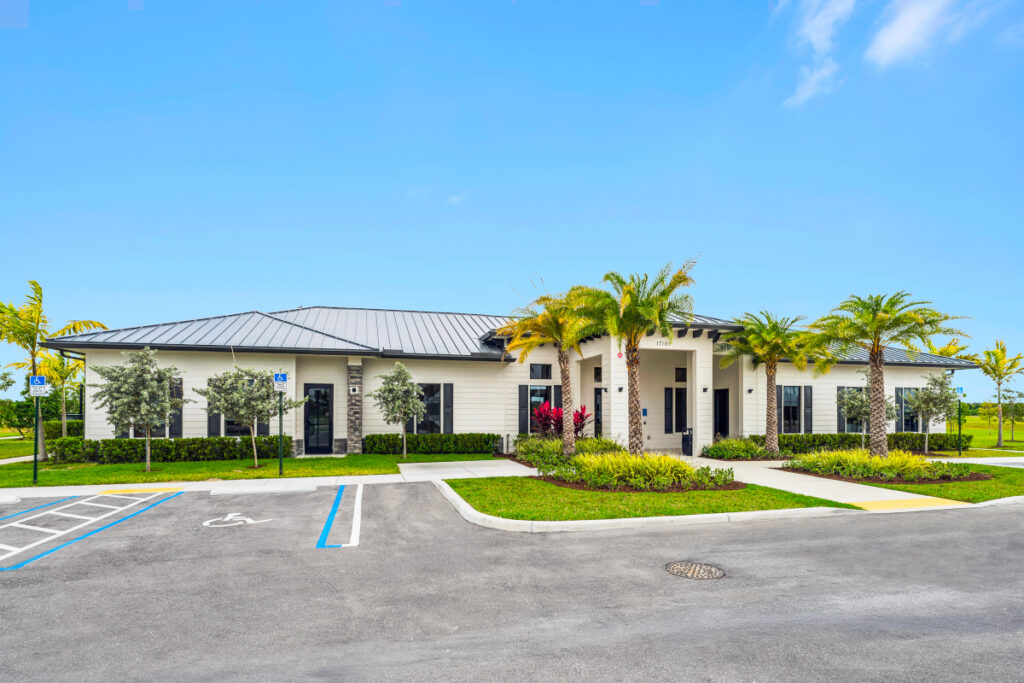
There are an estimated 4.3 million manufactured home sites in the United States. Approximately 30 percent of new manufactured homes are placed in a community. The U.S. has approximately 44,000 manufactured home communities. Approximately 18 percent of known communities in the U.S. were constructed prior to 1970. More than 60 percent were built during the 1970s and 1980s. About 5 percent of known communities have been built since 1991. Approximately 61 percent of known communities have an unknown, undocumented, or unclear construction date.
Communities by Size
About 29.7 percent of known communities are in a size category of 25 to 99 homesites. The next largest group is shared at 16.2 percent, with the communities that have one to 24 homesites and communities that have 100 to 299 homesites making up more than a third of the market. Three percent of the market is comprised of communities with between 300 and 499 homesites. About 1.1 percent has between 500 and 999 homesites. Only 0.2 percent of communities have 1,000 homesites or more. An estimated 33.5 percent of communities in the U.S. are listed as “unknown” size.
How Many People Live in Manufactured and Mobile Homes?
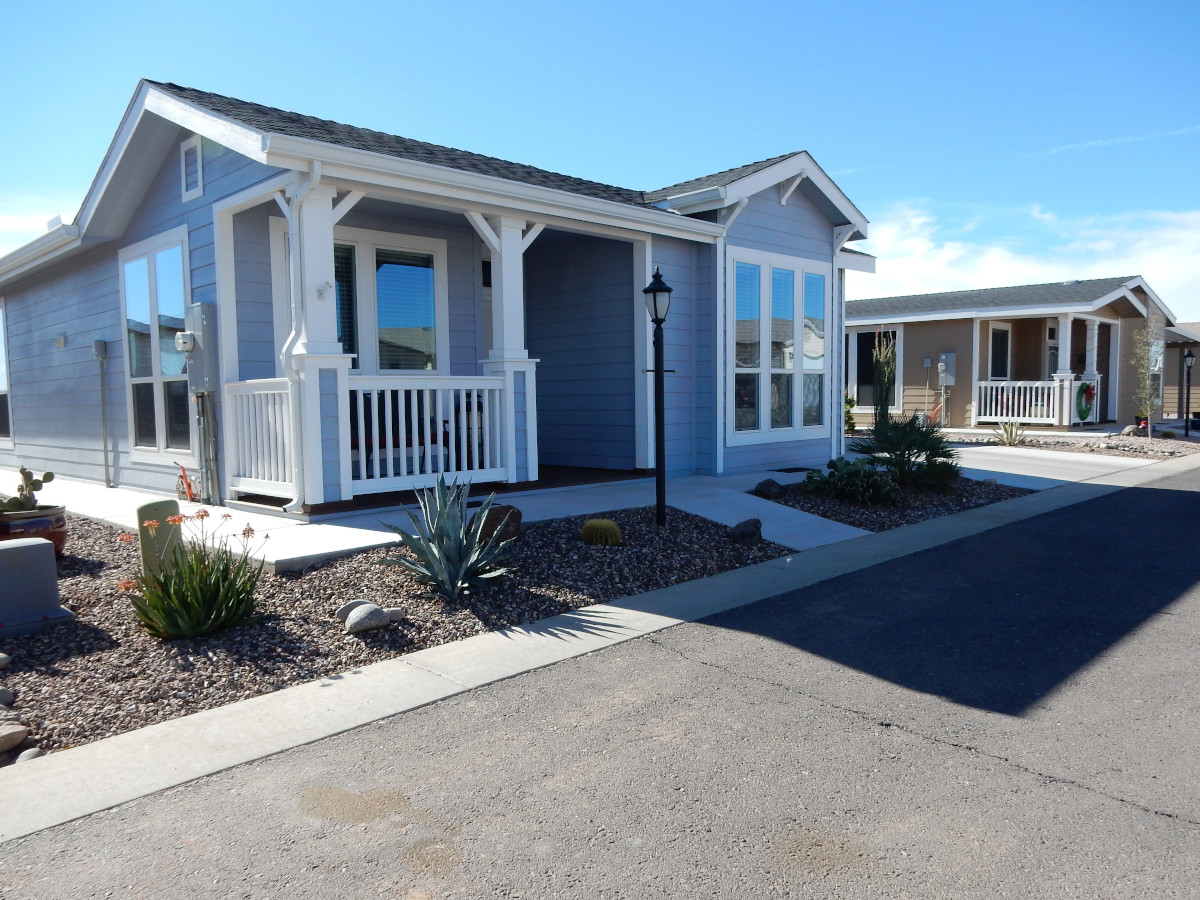
MHInsider’s review of annual manufactured housing industry trends and statistics shows about 20 million people in the U.S. live in a manufactured or mobile home. Manufactured homes make up 9 percent of annual new home starts. About 70 percent of new manufactured homes are titled as real estate on private land.
Who Are the Residents, Where Are They?
Residents of manufactured home communities are split evenly between Boomers and those who are older, versus Generation X and those who are younger. Forty-seven percent of residents report being located in a suburban area, while 33.2 percent are in rural settings, and 19.2 percent are in urban settings.
Resident Satisfaction
How much do residents and owners of manufactured homes appreciate their purchasing decision?
A 2025 study reveals 78 percent of people are satisfied with their mobile or manufactured home, and 68.5 percent of those who live in a manufactured home in a land-lease community report they are satisfied with the decision. About 73 percent of respondents said they made the home and land-lease decision, intending it to be the place they stay. More than 70 percent said they intend to stay for more than six years, and the average resident stay is more than 10 years. About 86 percent of residents said they own or are buying their home. Seventy-two percent of respondents said they would recommend living in a manufactured home, 61.1 percent said they would recommend living in a manufactured home community, and 81.4 percent of buyers said they had a favorable impression of manufactured housing.
More than 65 percent of residents said their home value has increased or stayed the same since purchase.
Rent and Occupancy
The average site rent in a manufactured housing community in the U.S. in 2025 was $782, and the average for an all-ages community was $751 and $841 for 55+ communities. The occupancy rate in manufactured home communities in 2025 average 95 percent, 97 percent in 55+ communities, and 94 percent in all-ages communities. Site rent increased in 2025, averaging 6 percent, 6.1 percent in all-age communities, and 5.9 percent in 55+ communities. Occupancy increases in all communities averaged 0.3 percent, and 0.4 percent in all-ages communities, and 0.2 percent in 55+ communities.
The U.S. markets with the highest site rent are all in California, with all-ages rents highest on average in Orange County ($2,155), San Luis Obispo ($1,800), and Sonoma County ($1,681). Santa Cruz ($3,674), Sonoma ($2,000), and Ventura ($1,623) counties average the highest site rent for 55+ communities.
The markets with the lowest site rent for all-ages manufactured homes are in Lynchburg, Virginia ($232), Hendry-Okeechobee, Florida ($339), and Hidalgo, Texas ($379). The lowest average site rent for 55+ communities are in Lynchburg, Virginia ($246), Cincinnati ($312), and Madison, Wisconsin ($352).
Manufactured home communities with the highest average occupancy rates are all in California, all at or very near full capacity. The communities with the lowest average occupancy are in Bay County, Florida (66%), Genesee County, Michigan (69%), and Wichita, Kansas (77%) for all-ages communities. The lowest average occupancy rates in the U.S. for 55+ communities are in Gary, Indiana (47%), Gettysburg, Pennsylvania (67%), and Tyler, Texas (78%).
Markets with the greatest year-over-year increase in occupancy for all-ages communities were Gillette, Wyoming, Topeka, Kansas, and Indian River, Florida. Markets with the greatest year-over-year increase in occupancy for 55+ communities were in Des Moines, Iowa (6.9%), Allegan-Muskegon-Ottawa counties, Michigan (5.8%), and Brownsville, Texas (3.4%).
Manufactured Housing Production
How many manufactured homes were built during 2025?
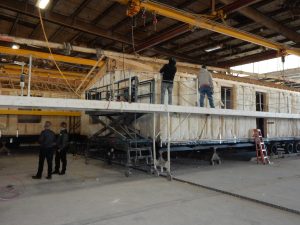
The manufactured housing industry produced 102,738 housing units during 2025, a slight decrease from the year prior. The homes derived from 147 plants in 28 states. The economic impact of manufactured home production is felt throughout the economy. In 2025, the industry was responsible for 61,389 jobs paying out more than $3.3 billion in wages in factories, retailers, land preparation, transportation, and utility connections. The industry created about $12.7 billion in sales and contributed $6.3 billion to the U.S. gross domestic product.
Top Marketplaces with Home Listing Price Above Average
New Homes Listing Price Above Average
- Indianapolis
- San Antonio
- Lakeland-Winter Haven, Fla.
- Saginaw-Bay City-Midland, Mich.
- Oklahoma City
Existing Homes Listing Price Above Average
- Minneapolis
- Wichita
- Los Angeles-Riveside
- Las Vegas
- Corpus Christi, Texas
Locales with Fewest Days on Market
- Erie, Pa.
- Dubuque, Iowa
- Lawton, Okla.
- Charleston, N.C.
- Oklahoma City
- South Bend, Ind.
- Corpus Christi, Texas
- Greensboro-Winston-Salem-High Point, N.C.
- Indianapolis
- San Antonio
-Data provided by Datacomp, MHVillage, and the Manufactured Housing Institute
What’s The State of the Manufactured Housing Industry?
MHlnsider updated its annual manufactured housing industry trends and statistics infographic, originally published in the May/June 2026 State of the Industry edition of MHInsider magazine. The following infographic includes data provided in summary earlier in the post and expands on information gathered from our surveys, including insight on rent and occupancy and average days on market.
2026 Manufactured Housing Industry Trends and Statistics Infographic