
What Is The State of the Manufactured Housing Industry?
2024 Updated Industry Facts and Figures
This post highlights some of the top-line trends in the manufactured housing industry, updated on an annual basis each May. Manufactured homes continue to be a crucial solution to the affordable housing crisis, filling the gap in the middle housing market for many customer segments. Judging by the numbers from our 2024 “State of the Industry” report on manufactured housing industry trends and statistics, manufactured housing industry continues to show positive signs for growth.
Competitive Advantage
What is the cost for a new manufactured home?
The average cost for a new manufactured home in 2023 was $113,951.97. For a multi-section home the average cost was $193,103 and the price for a new single-section home averaged $106,629. For an existing manufactured home the average sale price in 2023 was $69,781.
What is the cost per square foot for manufactured homes?
The average cost per square foot for a manufactured home is $130.53. For a multi-section home the price per square foot averages $140.07 and the price per square foot of a single-section home averages $110.17.

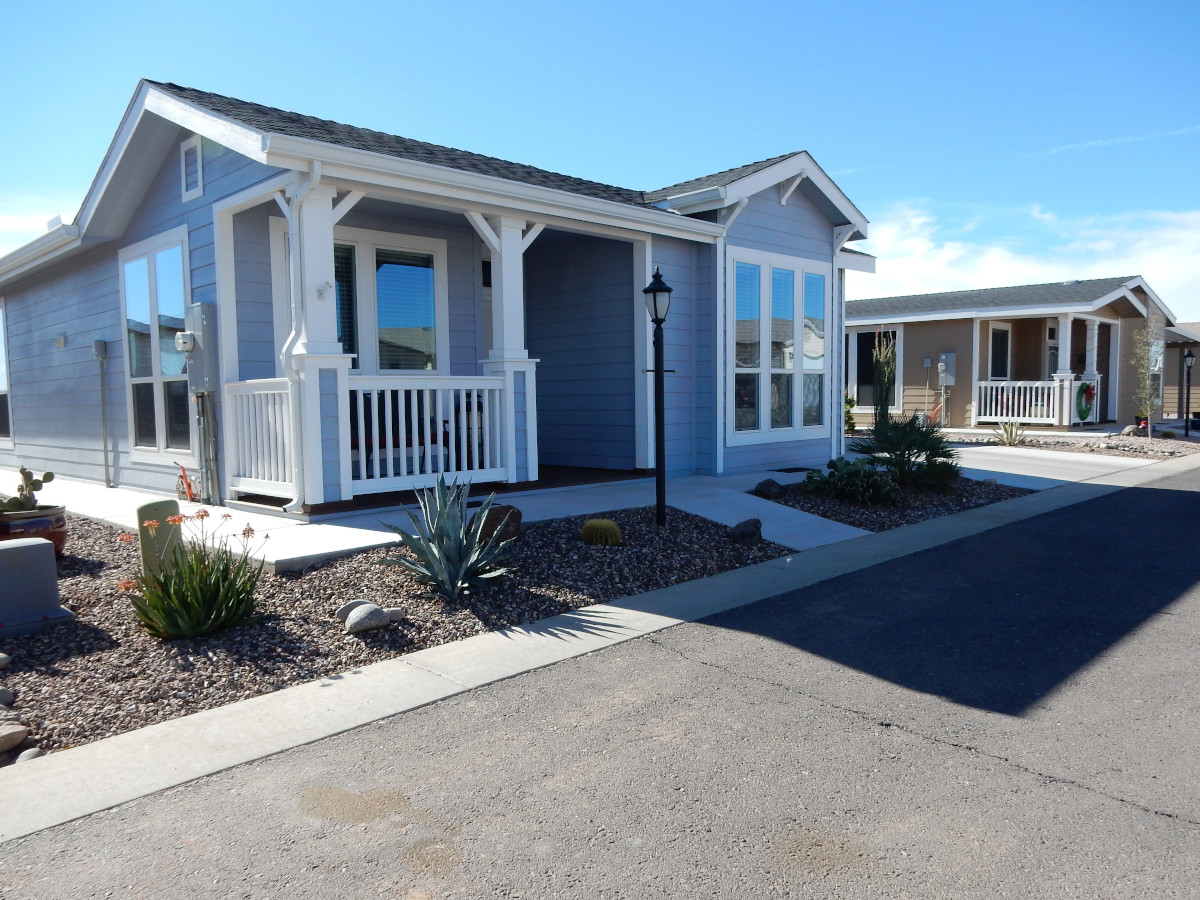
Community Living
How many manufactured homes are there, and how many go to communities?
There are an estimated 4.3 million manufactured home sites in the United States. Approximately 57 percent of new manufactured homes are placed in a community. The U.S. has approximately 43,000 manufactured home communities. More than a third of the country’s known communities were constructed in the 1950s through 1990s, 17.2 percent from 1950 through 1970 and 16.2 percent from 1971 to 1990.
Communities by Size
Approximately 29 percent of known communities are in a size category of 25 to 99 homesites. The next largest group is shared at 16 percent, with the communities that have one to 24 homesites and communities that have 100 to 299 homesites making up more than a third of the market. Three percent of the market is comprised of communities with between 300 and 499 homesites. One percent has between 500 and 999 homesites. Only 0.002 percent of communities have 1,000 homesites or more. An estimated 34 percent of communities in the U.S. are listed as “unknown” size.
How Many People Live in Manufactured and Mobile Homes?
MHInsider’s review of annual manufactured housing industry trends and statistics show 20.9 million people in the U.S. live in a manufactured or mobile home. Manufactured homes make up 8.6 percent of annual new home starts. About 73 percent of new manufactured homes are titled as personal property or “chattel”.
Resident Satisfaction
How much do residents and owners of manufactured homes appreciate their purchasing decision?
A recent study reveals 85 percent of people are satisfied with their mobile or manufactured home, a seven percent increase from the last survey conducted in 2018. Seventy percent of residents cite affordability as the key driver for choosing manufactured housing. Fifty-three percent of manufactured home owners said they purchased their home for its energy efficiency, and 49 percent choose their home for added space.
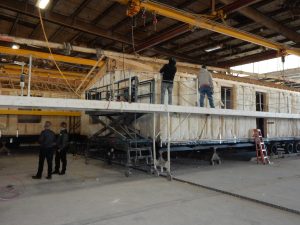
Manufactured Housing Production
How many manufactured homes were built during 2023?
Thirty-six U.S. manufactured home builders operating from 148 plants across the country produced 89,169 housing units during 2023. Shipment levels decreased slightly with rising interest rates in 2023 but home sales have been steady through the year, with the market exhibit signs of growth.
Top Manufacturers
What are the top manufactured home builders by market share?
- Clayton Homes — 48.98 percent
- Skyline Champion — 17.76 percent
- Cavco Industries — 13.04 percent
- Hamilton Homebuilder 2.91 percent
- Live Oak Homes — 2.38 percent
- Legacy Homes — 2.22 percent
- Jessup Housing — 1.87 percent
- American Home Star — 1.39 percent
- Adventure — 1.39 percent
- Jacobsen — 0.8 percent
Manufactured Housing Retail Markets
What are the top markets for manufactured housing retail sales?
- Houston
- Detroit
- Dallas-Forth Worth
- Austin, Texas
- San Antonio
- Phoenix
- Birmingham, Ala.
- Jacksonville, Fla.
- Knoxville, Tenn.
- Tampa-St.Pete-Clearwater
-Data provided by Datacomp, MHVillage, Statistical Surveys, and the Manufactured Housing Institute
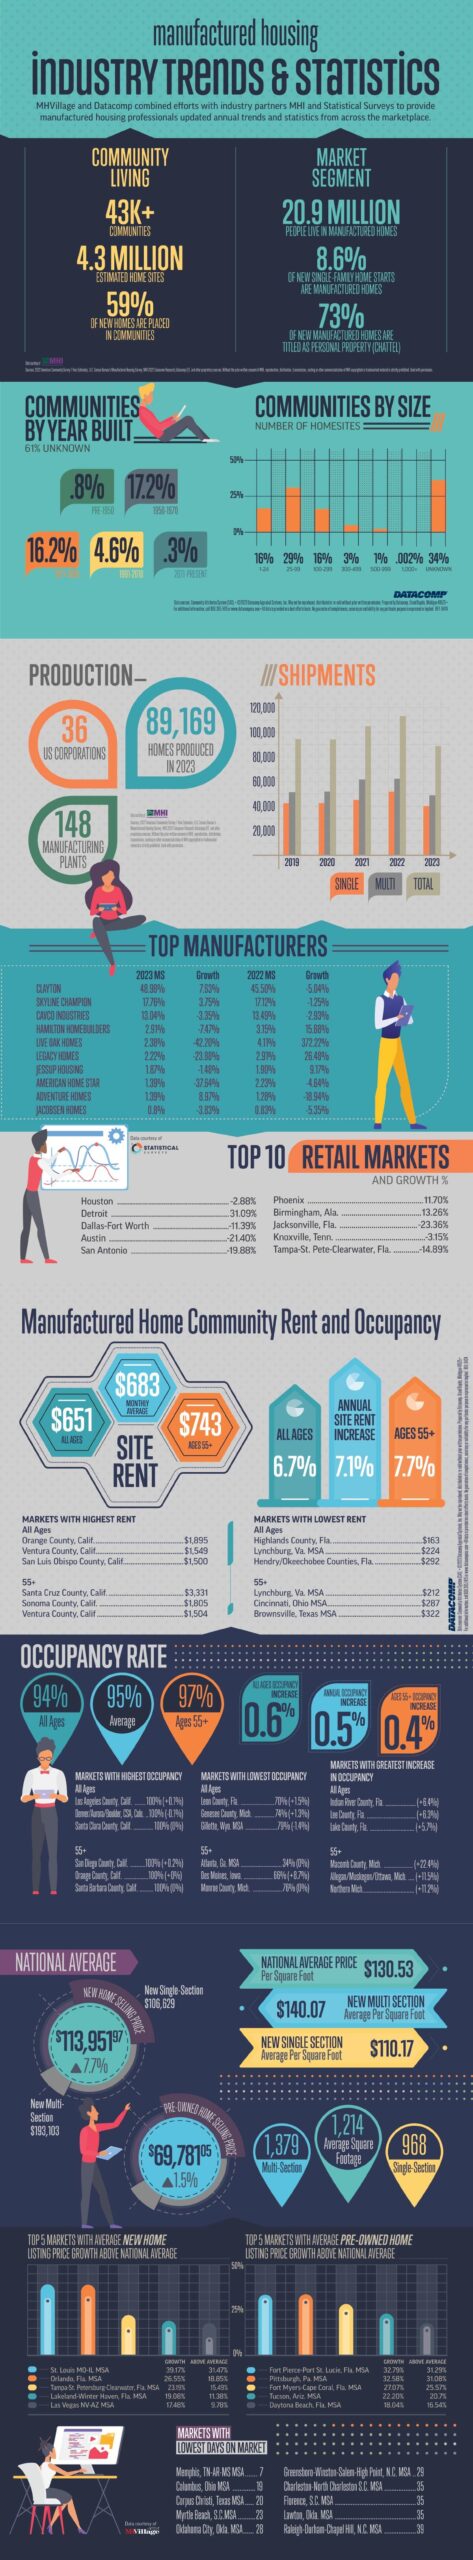
What’s The State of the Manufactured Housing Industry?
MHlnsider updated its annual manufactured housing industry trends and statistics infographic, originally published in the May/June 2024 State of the Industry edition of MHInsider magazine. The following infographic includes data provided in summary earlier in the post and expands on information gathered from our surveys, including insight on rent and occupancy and average days on market.
Manufactured Housing Industry Trends and Statistics Infographic


