
Corelogic Case-Shiller Index Slows in June
U.S. house prices rose 17.7 percent from the second quarter of 2021 to the second quarter of 2022, including a 4 percent quarter-to-quarter hike, according to the Federal Housing Finance Agency House Price Index.
FHFA’s seasonally adjusted monthly index for June was up 0.1 percent from May.
“Housing prices grew quickly through most of the second quarter of 2022, but a deceleration has appeared in the June monthly data,” FHFA Supervisory Economist in the Division of Research and Statistics William Doerner said. “The pace of growth has subsided recently, which is consistent with other recent housing data.”
Significant Findings from FHFA’s Recent Report
- Nationally, the U.S. housing market has experienced positive annual appreciation each quarter since the start of 2012.
- House prices rose in all 50 states and the District of Columbia between the second quarters of 2021 and 2022. The five areas with the highest annual appreciation were: 1) Florida 29.8 percent; 2) Arizona 25.5 percent; 3) North Carolina 25.2 percent; 4) Montana 24.9 percent; and 5) Tennessee 24.3 percent. The areas showing the lowest annual appreciation were: 1) District of Columbia 5.2 percent; 2) North Dakota 10.6 percent; 3) Louisiana 10.8 percent; 4) Minnesota 11.3 percent and 5) Maryland 12 percent.
- House prices rose in all of the top 100 largest metropolitan areas over the last four quarters. Annual price increases were greatest in North Port-Sarasota-Bradenton, FL, where prices increased by 36.4 percent. Prices were weakest in Washington-Arlington-Alexandria, DC-VA-MD-WV (MSAD), where they increased by 9.1 percent.
- Of the nine census divisions, the South Atlantic division recorded the strongest four-quarter appreciation, posting a 23 percent gain between the second quarters of 2021 and 2022 and a 5.2 percent increase in the second quarter of 2022. Annual house price appreciation was weakest in the West North Central division, where prices rose by 13.9 percent between the second quarters of 2021 and 2022.
The FHFA HPI is the nation’s only collection of public, freely available house price indexes that measure changes in single-family home values based on data from all 50 states and over 400 American cities that extend back to the mid-1970s. The FHFA HPI incorporates tens of millions of home sales and offers insights about house price fluctuations at the national, census division, state, metro area, county, ZIP code, and census tract levels. FHFA uses a fully transparent methodology based upon a weighted, repeat-sales statistical technique to analyze house price transaction data.
FHFA releases HPI data and reports on a quarterly and monthly basis. The flagship FHFA HPI uses seasonally adjusted, purchase-only data from Fannie Mae and Freddie Mac. Additional indexes use other data including refinances, FHA mortgages, and real property records. All the indexes, including their historic values, and information about future HPI release dates are available on FHFA’s website: https://www.fhfa.gov/HPI.
Corelogic Case-Shiller Index Slows in June
S&P Dow Jones Indices released the latest results for the S&P CoreLogic Case-Shiller Indices, the leading measure of U.S. home prices. Data released for June 2022 show that home prices continue to increase across the United States.
The National Home Price Index, covering all nine U.S. census divisions, reported an 18 percent annual gain in June, down from 19.9 percent in the previous month. The 10-City Composite annual increase came in at 17.4 percent, down from 19.1 percent in the previous month. The 20-City Composite posted an 18.6 percent year-over-year gain, down from 20.5 percent in the previous month.
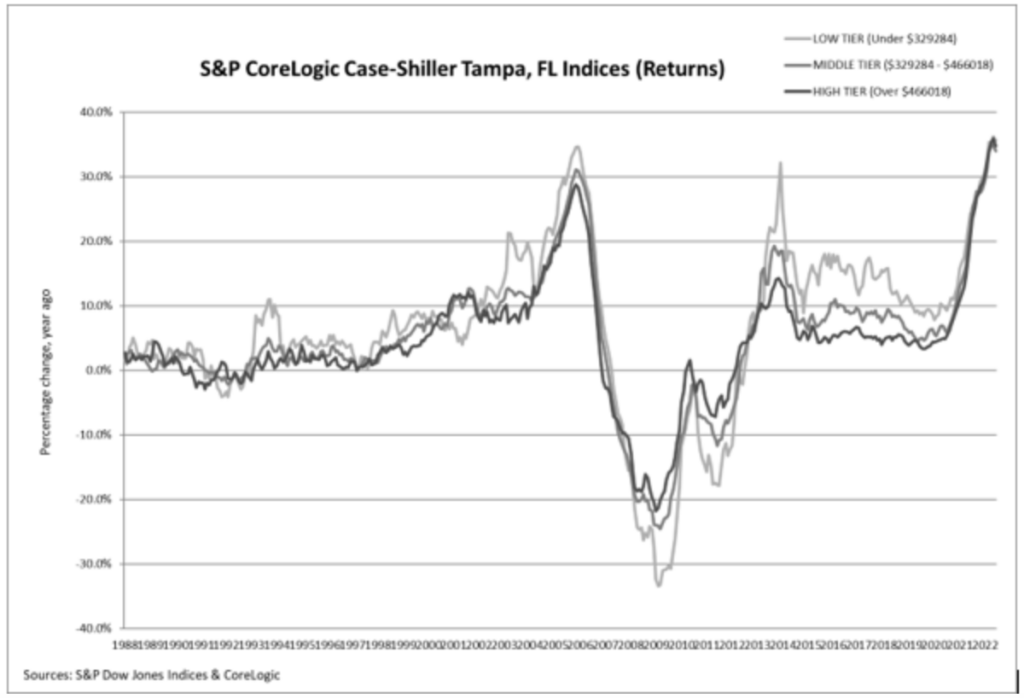
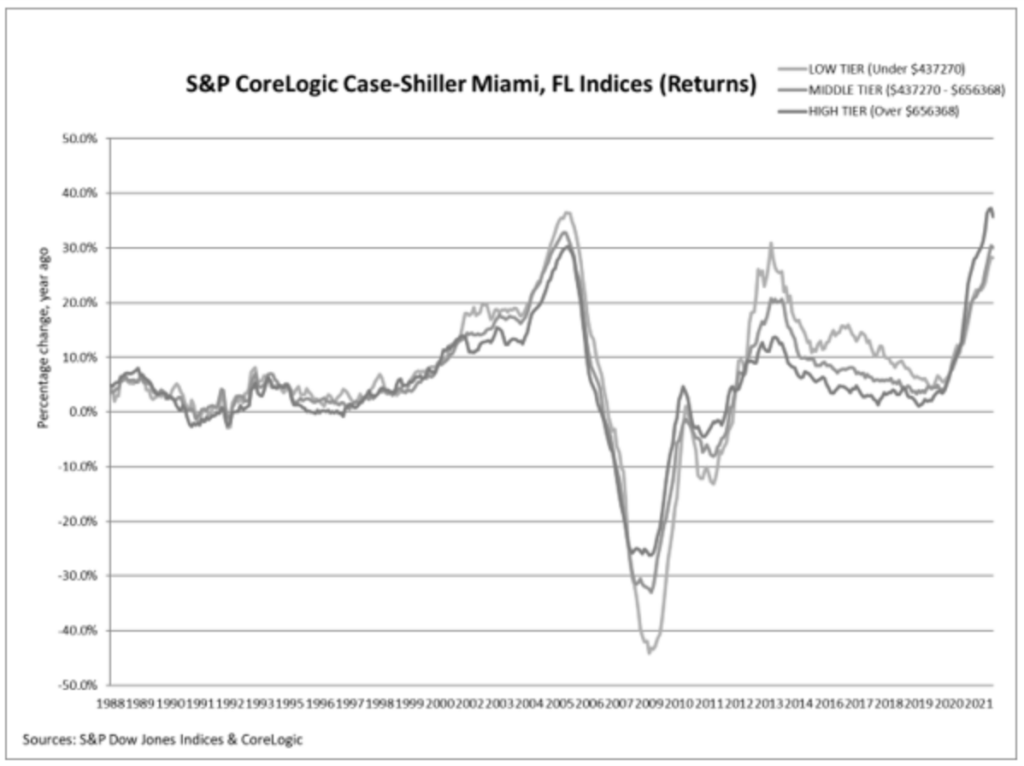
Tampa, Miami, and Dallas reported the highest year-over-year gains among the 20 cities in June. Tampa led the way with a 35 percent year-over-year price increase, followed by Miami in second with a 33 percent increase, and Dallas in third with a 28.2 percent increase. Only one of the 20 cities reported a higher price increase in the year ending June 2022 versus the year ending May 2022.
Charts below compare year-over-year returns of different housing price ranges for Tampa and Miami.
MHInsider is a product of MHVillage, the largest marketplace or mobile and manufactured housing, with listings for more than 43,000 manufactured home communities. Bookmark MHInsider for all of your manufactured housing news.


