A Quarterly Overview of Manufactured Housing Industry Real Estate Investment Trusts
The research team at Hoya Capital Real Estate is excited to continue our quarterly column published in partnership with MHInsider to provide insight and commentary on publicly-traded manufactured housing stocks. Every quarter, we’ll publish an update to discuss the stock performance, earnings results, and major news and events reported by manufactured housing real estate investment trusts, or MH REITs.
Overview of MH REITs
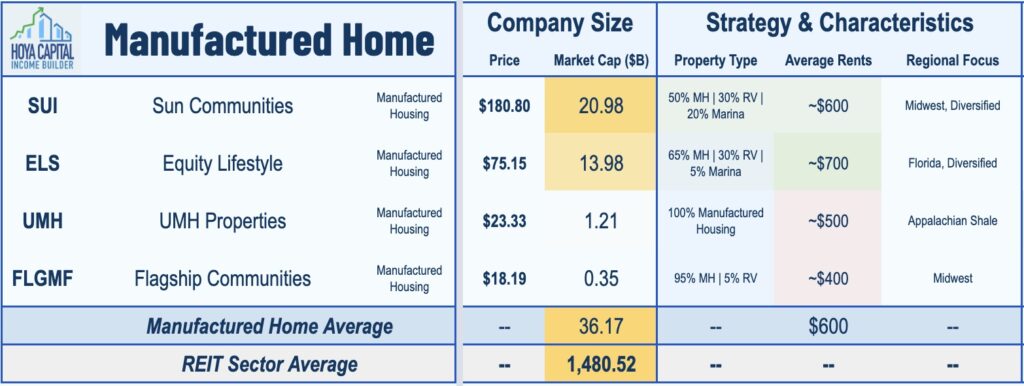
There are three U.S. exchange-listed Manufactured Housing REITs that collectively account for roughly $35 billion in market value: Equity LifeStyle (ELS), Sun Communities (SUI), UMH Properties (UMH). Additionally, newly-listed Flagship Communities (FLGMP) trades on the Toronto Stock exchange.
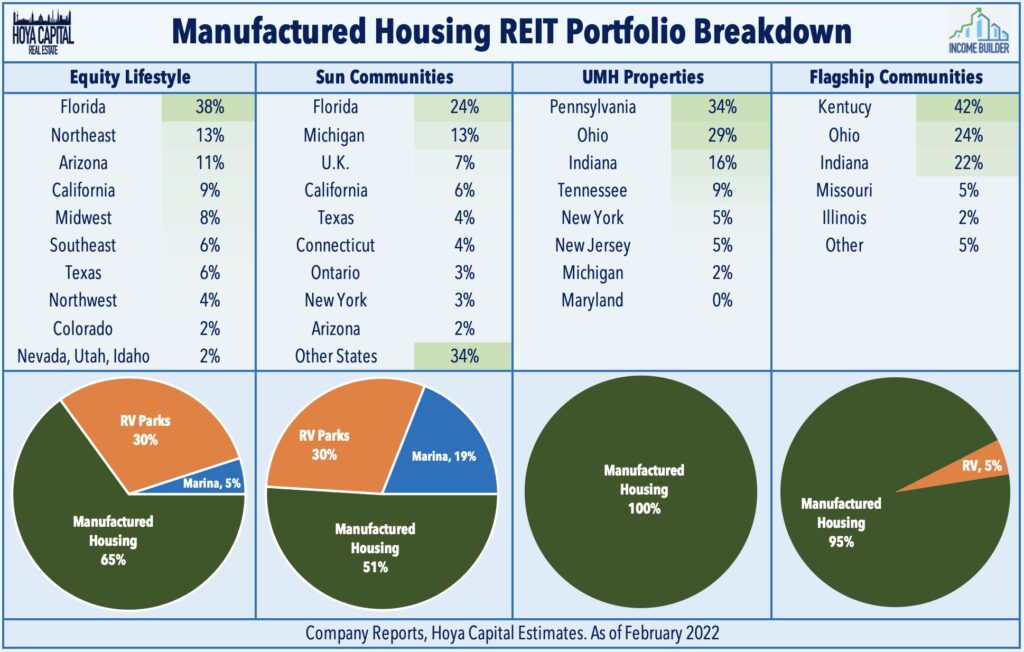
Manufactured Housing REITs collectively own roughly 350,000 manufactured housing and RV sites across the United States with a portfolio skewed toward higher-end communities with a more “retiree-oriented” demographic than the all-ages community.
Through a series of acquisitions, Equity LifeStyle and Sun Communities have recently expanded into boat marinas as well while the smaller UMH Properties and newly-listed Flagship Communities continue to focus primarily on traditional manufactured housing communities.
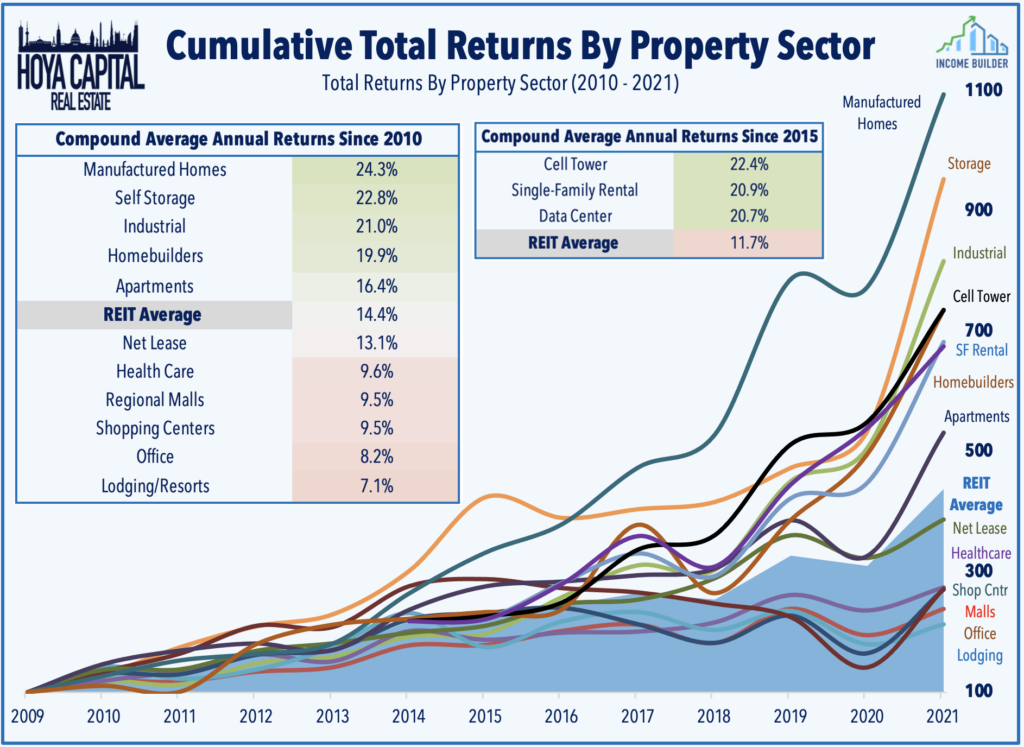
Manufactured housing REITs have emerged over the past decade from relative obscurity into several of the largest publicly-traded owners of real estate in the world. Beneficiaries of the lingering housing shortage across the United States resulting from a decade of underbuilding, manufactured housing REITs have been the single-best performing REIT sector since the start of 2010, delivering an incredible 24.3% annual compound total returns from 2010 through 2021.

With total returns of 42.0%, Manufactured housing REITs outperformed the broad-based Equity REIT Index for a remarkable ninth-straight year in 2021, the longest streak of outperformance for any property sector since the dawn of the “Modern REIT Era” in the early 1990s.
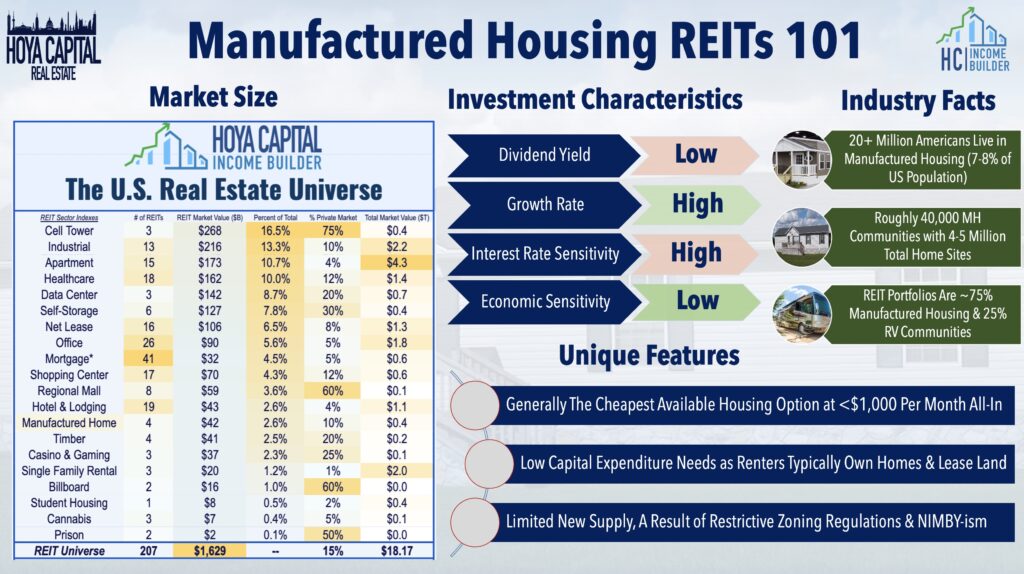
From an investment perspective, despite their high growth rates, MH REITs are a traditionally defensive and countercyclical sector due to the “sticky” nature of MH demand and cash flows. While these REITs are not known for their high dividend yields, these REITs have delivered some of the strongest rates of dividend growth of any REIT sector.
Recent MH REIT Fundamental Performance
Symptomatic of the lingering housing shortage in the United States, rents are soaring at the fastest pace on record in essentially every segment of the residential rental market across the country. Interestingly, manufactured housing renters have so far escaped the double-digit rates of rent growth seen in apartment and single-family rental markets, as MH REITs raised rents by just 3.9%, on average, in 2021 which was only a bit higher than the average annual increase of 3.5% over the past decade.
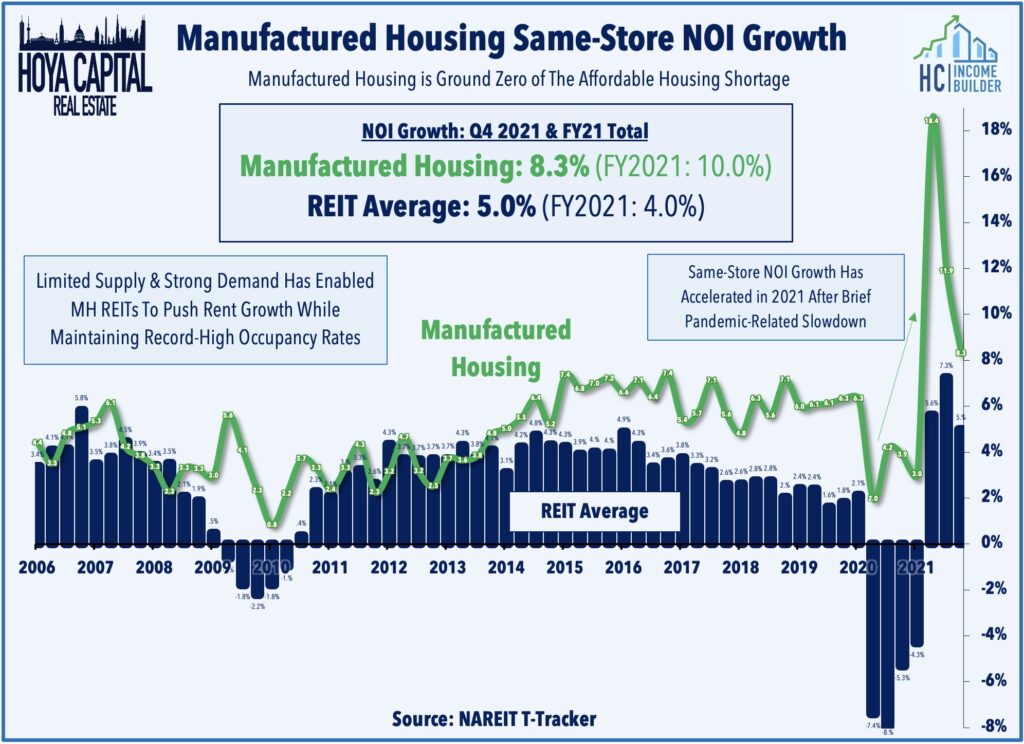
Manufactured Housing REITs still managed to deliver their strongest year on record across nearly all critical earnings metrics. Driven by strong performance in their RV segment and occupancy increase in their core manufactured housing parks, the three major MH REITs – ELS, SUI, and UMH – delivered same-store NOI growth of 10% for full-year 2021 and these REITs are expecting NOI growth of another 8% in 2022 at the midpoint of their initial financial outlook.
Growth in funds from operations (“FFO”) – the earnings per share “equivalent” for REITs – is driven by the combination of same-store “organic” growth and by external growth through acquisitions and new development. Manufactured housing REITs delivered incredible FFO growth of over 22% in 2021, which was significantly above their earlier estimates and was the strongest year of FFO growth on record for all three of these REITs. The initial outlook for 2022 calls for average FFO growth of 8.1%, but these REITs have historically provided conservative estimates in their initial outlook and raised their growth targets throughout the year, so another year of double-digit earnings growth is certainly achievable.
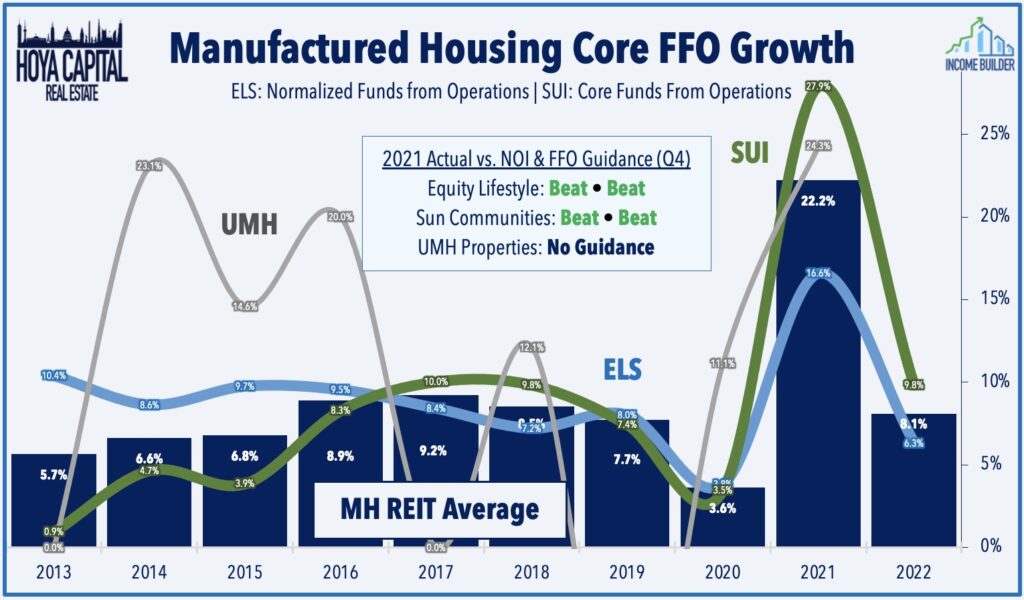
Utilizing a strong cost of equity capital, these REITs have continued to grow externally by adding units to existing sites and by growing via acquisitions and site expansions. MH REITs acquired $2.15 billion worth of properties in 2021 – the largest full-year total on record. The most significant deal in 2021 was Sun Communities’ $1.3B purchase of Park Holidays, which is the second largest owner and operator of holiday communities in the UK, with 40 owned and operated communities and an additional two managed communities. The acquisition, which is expected to be accretive to 2022 Core FFO per share, will represent approximately 7% of the Company’s properties and 8% of its total real estate asset value.

Manufactured Housing Industry Data Points
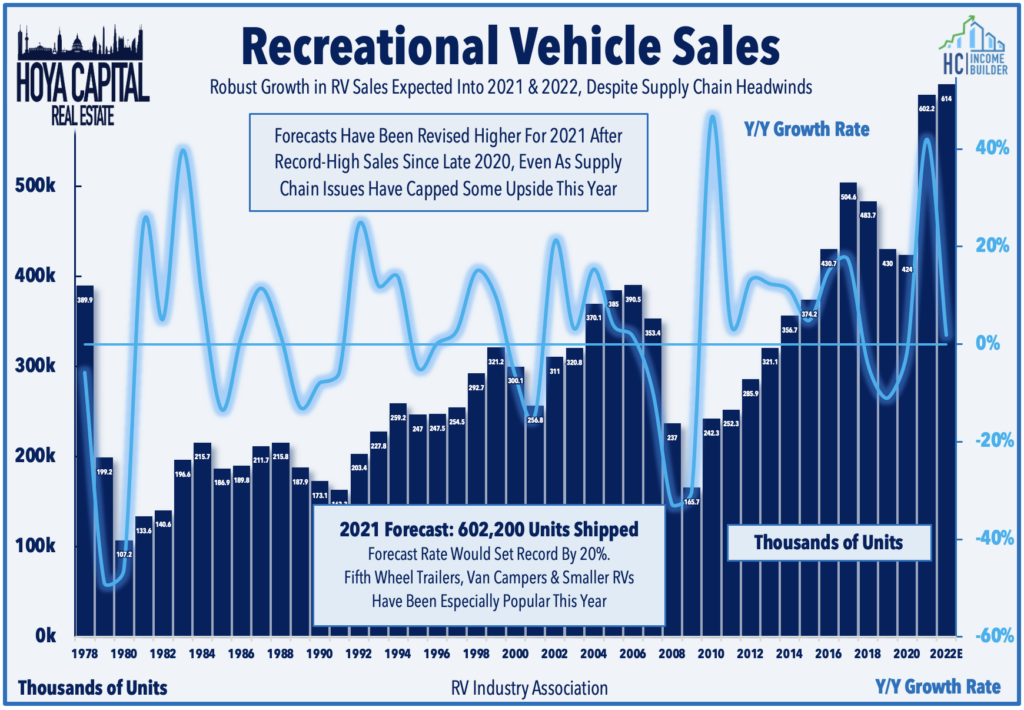
MH REITs’ amplified focus on analogous asset classes – RV parks and marinas – was perfectly-timed, providing an added external growth tailwind as the “Work-From-Anywhere” era has fueled soaring RV, boat, and vacation home sales. The RV Industry Association (“RVIA”) reported in January that despite supply chain issues and labor shortages, 2021 was the best year on record for shipments of recreational vehicles with shipments of 600,240 RVs last year — beating 2017’s record by 19 percent. The RVIA sees the momentum continuing into 2022, predicting another record year with 614,000 shipments anticipated by the end of the year.
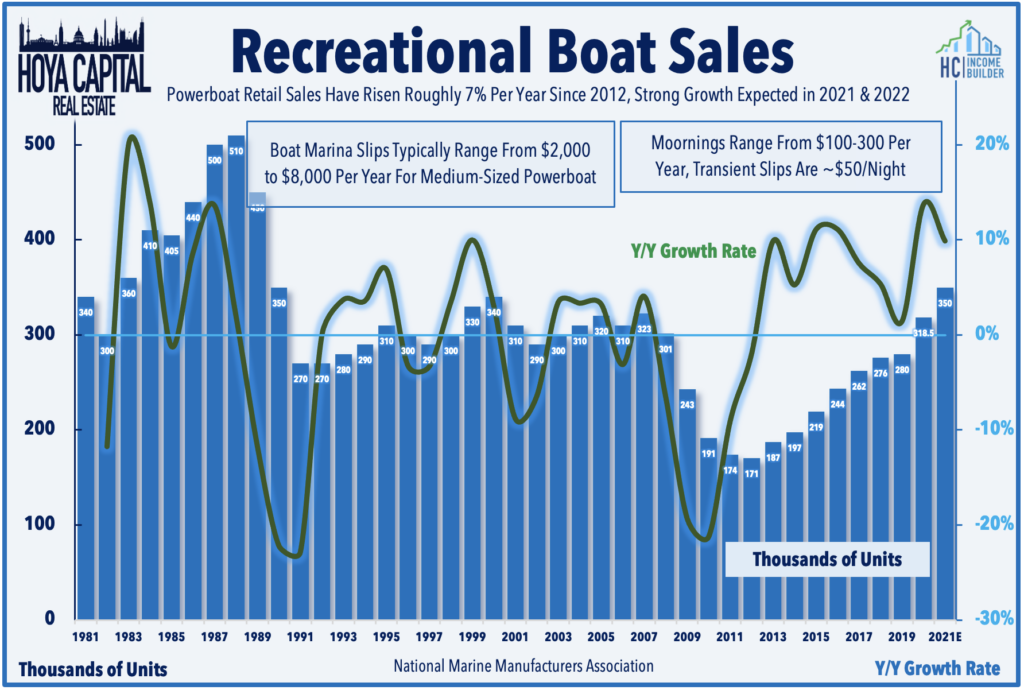
The National Marine Manufacturers Association (“NMMA”), meanwhile, reported last month that following record sales in 2020, powerboat sales exceeded 300,000 units for only the second time in 15 years. As of early January, the NMMA is projecting new boat sales to exceed the 300,000 unit mark for a third straight year and surpass 2021 totals by as much as 3%. Sun Communities has been the most active of the four MH REITs in growing their marina business, which now accounts for nearly 20% of its annual revenues. Marinas offer substantial operating parallels to the RV business and SUI is now the largest owner of marina slips in the United States, followed closely behind by Equity LifeStyle.
MH REITs Key Takeaways
While the share prices of MH REITs have uncharacteristically lagged through the first two months of 2022 as the sector has been pressured by concerns over rising rates, inflation, a broader rotation from growth into value, the long-term fundamental outlook for the sector remains highly promising given the lingering undersupply of housing units across the United States and these REITs’ position as leading providers of affordable housing.
Consistent with the trends across the residential REIT sectors over the past twelve months MH REITs delivered their strongest year on record in 2021 across essentially every critical earnings metric, and the momentum is expected to continue into 2022. Low supply and strong demand have driven stellar fundamental performance for MH REITs over the past half-decade, and shareholders have been rewarded with a record-setting nine consecutive years of outperformance relative to the REIT sector average.
MH REITs REPORT Terms Defined
FFO (Funds From Operations): The most commonly accepted and reported measure of REIT operating performance. Equal to a REIT’s net income, excluding gains or losses from sales of property and adding back real estate depreciation.
AFFO (Adjusted Funds From Operations): A non-standardized measurement of recurring/normalized FFO after deducting capital improvement funding and adjusting for “straight line” rents.
NOI (Net Operating Income): Typically reported on a “same-store” comparable basis, NOI is a calculation used to analyze the property-level profitability of real estate portfolios. NOI equals all revenue from the property, minus all reasonably necessary operating expenses.
Hoya Capital Disclosures
I am/we are long ELS and SUI. I am not receiving compensation for it. It is not possible to invest directly in an index. Index performance cited in this commentary does not reflect the performance of any fund or other account managed or serviced by Hoya Capital Real Estate. Nothing on this site nor any published commentary by Hoya Capital is intended to be investment, tax, or legal advice or an offer to buy or sell securities. Information presented is believed to be factual and up-to-date, but we do not guarantee its accuracy and should not be considered a complete discussion of all factors and risks. A complete discussion of important disclosures is available on our website www.HoyaCapital.com.


