
Domestic Home Prices Rise 14.9% in 20 Cities
The Case-Shiller Index, a leading measure of U.S. home prices, shows the average cost of a home continues to increase in all measured markets, with all-time high home price surges in several cities.
Data released in late June for prices through April 2021 show the rise and more than 27 years of history are available for the data series.
Home Prices Year-over-Year
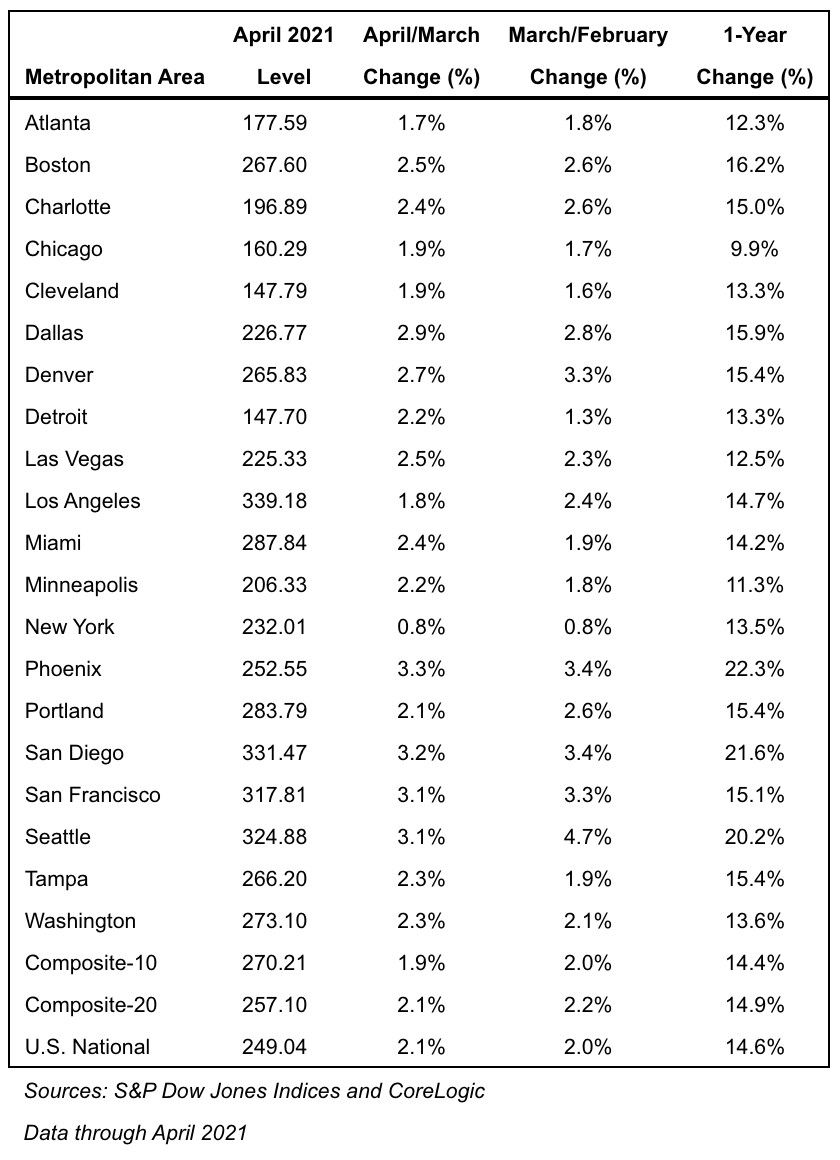
The S&P CoreLogic Case-Shiller U.S. National Home Price NSA Index, covering all nine U.S. census divisions, reported a 14.6% annual gain in April, up from 13.3% in the previous month. The 10-City Composite annual increase came in at 14.4%, up from 12.9% in the previous month. The 20-City Composite posted a 14.9% year-over-year gain, up from 13.4% in the previous month.
Phoenix, San Diego, and Seattle reported the highest year-over-year gains among the 20 cities in April. Phoenix led the way with a 22.3% year-over-year price increase, followed by San Diego with a 21.6% increase and Seattle with a 20.2% increase. All 20 cities reported higher price increases in the year ending April 2021 versus the year ending March 2021.
Home Prices Month-over-Month
Before seasonal adjustment, the U.S. National Index posted a 2.1% month-over-month increase, while the 10-City and 20-City Composites posted increases of 1.9% and 2.1%, respectively, in April.
After seasonal adjustment, the U.S. National Index posted a month-over-month increase of 1.6%, and the 10-City and 20-City Composites posted increases of 1.4% and 1.6%, respectively. In April, all 20 cities reported increases before and after seasonal adjustments.
Case-Shiller Analysis of U.S. Home Prices

“Housing prices accelerated their surge in April 2021,” S&P DJI Managing Director and Global Head of Index Investment Strategy Craig J. Lazzara said. “The National Composite Index marked its eleventh consecutive month of accelerating prices with a 14.6% gain from year-ago levels. This acceleration is also reflected in the 10- and 20-city composites.”
The market’s strength is broadly-based: all 20 cities rose, and all 20 gained more in the 12 months ended in April than they had gained in the 12 months ended in March.
“April’s performance was truly extraordinary,” Lazzara said. “The 14.6% gain in the National Composite is literally the highest reading in more than 30 years of S&P CoreLogic Case-Shiller data.”
Housing price gains in all 20 cities accelerated, all in the top quartile of historical performance. In 15 cities, price gains were in the top decile. Five cities – Charlotte, Cleveland, Dallas, Denver, and Seattle – joined the National Composite in recording their all-time highest 12-month gains.
“We have previously suggested that the strength in the U.S. housing market is being driven in part by reaction to the COVID pandemic, as potential buyers move from urban apartments to suburban homes,” Lazzara said. “April’s data continue to be consistent with this hypothesis. This demand surge may simply represent an acceleration of purchases that would have occurred anyway over the next several years. Alternatively, there may have been a secular change in locational preferences, leading to a permanent shift in the demand curve for housing. More time and data will be required to analyze this question.”
Phoenix’s 22.3% increase led all cities for the 23rd consecutive month, with San Diego (+21.6%) and Seattle (+20.2%) providing strong competition. Although prices were strongest in the West (+17.2%) and Southwest (+16.9%), every region logged double-digit gains.
Take a look at some manufactured housing industry trends and statistics, bookmark the MHInsider homepage, and check back regularly for manufactured housing news!


