Home Blog Page 33

Learning from the History of the Homeownership Rate

Homeownership rate joint housing studies harvard don layton

By Don Layton

Don Layton Homeownership
Donald Layton, Joint Center for Housing Studies of Harvard University

Among the thousands of statistics that the government produces to describe the country’s economic and social health, the homeownership rate has an exalted place among policymakers in Washington. This single statistic – currently running about 65% – is regarded as one of the most important comprehensive measures of how well the country’s socioeconomic system is “delivering the goods” for the typical American family. A high homeownership rate reflects that many families have income large enough not only to cover monthly living costs but also to generate enough cash surplus to save for a downpayment and then to sustain homeownership. It also indicates that the cost of purchasing a house and financing a mortgage on it is affordable.

In addition, homeownership is regarded as causing an improvement in the quality of life of a typical family. It is the most common method for such a family to build wealth: by paying down mortgage principal each month and participating in the long-term appreciation of home values, a family can build net worth that can be used for retirement or other needs, including helping the next generation.

Such wealth creation, therefore, provides a major social as well as an economic benefit. Add in protection against being forced to relocate by a landlord due to unaffordable rent increases or other actions, and homeownership is validly seen as a source of family stability.

Not surprisingly, politicians and policymakers are therefore often focused on finding ways to sustainably push the homeownership rate higher. As a participant in the housing finance policy community since 2012, when I became CEO of Freddie Mac, I have heard often how crucial housing finance was in creating the much higher rate of homeownership that evolved after World War II – roughly 65%, compared to less than 50% prior to the Great Depression. I have also heard frequently from housing advocates how a specific proposed change in housing finance would result in many more families (the phrase “millions” is sometimes used) becoming homeowners. Astonishingly, despite such claims, through decades of the government implementing various programs in housing finance aimed at increasing the sustainable rate of homeownership, it remains today at almost exactly the level achieved over 50 years ago – about 65%.

It thus seems time to step back, take stock, and look for fresh ideas.

As such a step, my newly-published paper “The Homeownership Rate and Housing Finance Policy: Part 1 – Learning from the Rate’s History,” reviews the history of the U.S. homeownership rate over roughly the past 130 years to learn what policies will or will not work.

A summary of the history of home finance, as it is related in the full paper, is as follows:

The Pre-Depression Era: 1890-1930

The U.S. homeownership rate was at 46.5%, plus or minus 1.5%, from when records began to be kept in 1890 through to the end of the Roaring ‘20s four decades later. During this time, modern life began to take hold:  the percentage of the population that was urban, rather than rural, went from 35% to 56% and the number of registered automobiles went from zero to almost 24 million.  In fact, by 1930, seventy percent of American households were electrified to support the lightbulb, and then-modern electric marvels – such as the radio, record player, and telephone – were starting to become common in homes. Yet, despite this massive change in daily life, surprisingly the homeownership rate remained almost unchanged, Of course, as this was an era of small government, housing issues were largely left to market forces, so there was no government effort aimed at increasing the rate to 50% or more.

The Transition Era: 1930-1970

Through the early years of the Depression, more than one third of the country’s 25,000 banks disappeared and the unemployment rate rose to a staggering 25%. It is assumed the homeownership rate dropped during these years as well, but there is no readily available data to know for sure as the statistic was only collected every ten years via the census.  However, by the 1940 census, the homeownership rate sat at 43.6%, down only about four percentage points from its 1930 level of 47.8%, despite the breadth of decline in other parts of the economy. The federal government, first under President Hoover but mainly then President Roosevelt, initiated massive government intervention efforts, including in housing and housing finance, to aid American families and to dig out of the Depression.  In fact, there was a virtual revolution in how the mortgage system worked, with the creation of the “American” mortgage – with a long term (now 30 years), a fixed rate, full self-amortization, a loan-to-value ratio of 80% or more, and free prepayment at any time for any reason.  Prior to 1930, the typical mortgage was for only 50% of a house’s value, the term was a maximum of 10 years, and there was little if any amortization.  By 1940, of course, the country was starting wartime production, greatly aiding in the recovery.

After the war was won, the homeownership rate emerged at 53% in 1945, and then continued to climb to 60% in 1955, and on to better than 64% by 1969. This was totally unprecedented.  The causes of this incredible achievement are many.  The change to housing finance engineered during the 1930s played a major role, but there were other fundamental changes in American life that were significantly responsible as well. These included the GI Bill helping to create a much larger middle class, as well as the invention in the late 1940s of the modern suburbs that were, and still mostly are, centered around the ownership of the traditional single-family home.

The Modern Era: 1970 to Today

During the 50-year era beginning in 1970, the homeownership rate remained stable at around 65%, give or take 2 percentage points, echoing how it had not changed much in the forty years of 1890 to 1930.  In fact, it started the era at 64.3% and ended up almost unchanged a full fifty years later at 65.3% when the pandemic hit. In the late ’90s the rate did increase to 67%, and then in the early 2000s nearly hit 70% – which was beginning to look like a sustainable increase beyond the 65% range.  However, this at least in part reflected the early days of the mortgage bubble, and its bursting was so overwhelming that the homeownership rate then began a long-term decline.  It eventually reached its bottom of 62.9% in April of 2016, a full ten years after the house price peak in 2006 and six to seven years after the end of the recession.

During this 50-year period, there were signature programs in housing finance that were designed to increase the homeownership rate, such as the Community Reinvestment Act and later the GSE obligation to meet certain “affordable goals.”  Unfortunately, it is clear from the data that none of these programs moved the needle at a sizeable level, although they might have in smaller numbers. 

A Foundation for Housing Policy

The objective of this Part 1 historical review is to establish a foundation for determining what policy choices, especially in the field of housing finance, would likely be successful in finally and sustainably raising the homeownership rate past the 65% range to 70% or even more – which will then be explored in Part 2.

It would indeed be a major socioeconomic success for the United States if the homeownership rate could rise to 70% or 75% on a sustainable basis: about 6 to 13 million more families (respectively) would become homeowners, with all the economic and social benefits that increase would generate. But, after so many programs designed to do just that have failed for the past half-century, it obviously isn’t an easy thing to accomplish – in fact, one inescapable conclusion from history is how incredibly hard it is.  The stubborn racial homeownership rate gap also plays a prominent role in how to increase the aggregate rate, as will also be described in next part.

In particular, Part 2 will include an examination of the proposal made by the Biden campaign to establish a large and generous down payment assistance program with Federal government funding. In my view, that proposal, which represents a significant change in the thinking that has dominated policymaking for many years, does indeed have the potential to be a major component of a successful effort to, at long last, materially and sustainably raise the homeownership rate materially above its long-standing 65% level.

Don Layton is a senior industry fellow with the Joint Center for Housing Studies of Harvard University and previously served as CEO of Freddie Mac. He worked for nearly 30 years at JPMorgan Chase and its predecessors, starting as a trainee and retiring in 2004 as one of its top three executives. The full publication of his homeownership research can be found at www.jchs.harvard.edu.


Bookmark MHInsider for the latest in manufactured housing news, and to keep up on all of the manufactured housing industry trends.

MH REITs Report for Q3 2021

Parke Place Manufactured Home Community April rent MH REITs Report
Parke Place Estates in Elkhart, Ind., a UMH Properties community.

A Quarterly Review of Manufactured Housing Real Estate Investment Trusts

The research team at Hoya Capital Real Estate is excited to continue our quarterly column published in partnership with MHInsider to provide insight and commentary on publicly-traded manufactured housing stocks. Every quarter, we’ll publish an update to discuss the stock performance, earnings results, and major news and events reported by manufactured housing real estate investment trusts, or MH REITs.

Overview of MH REITs

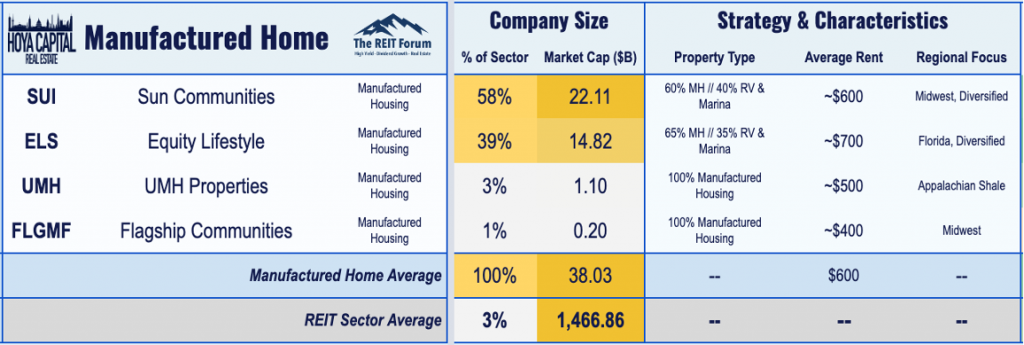
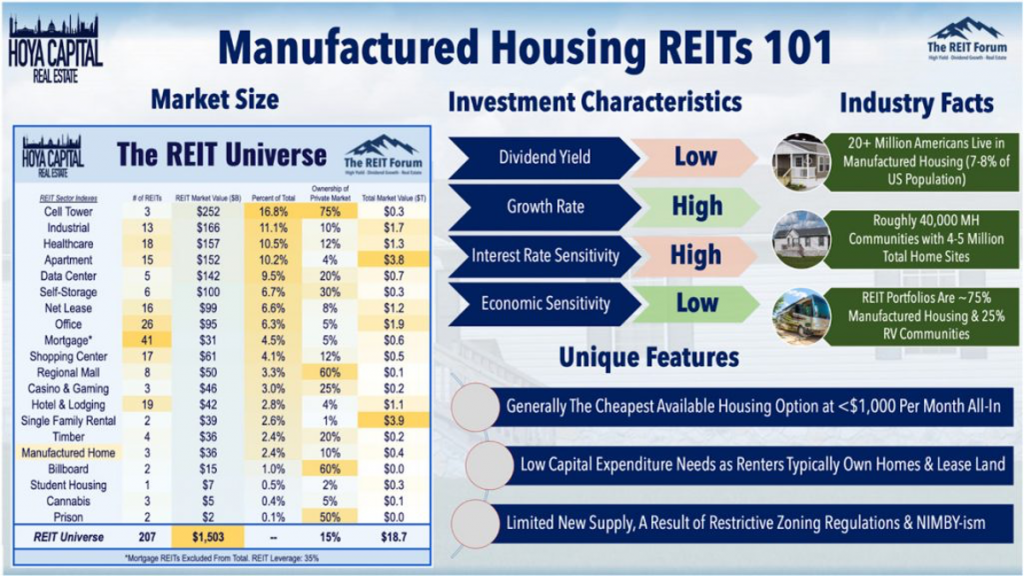
There are three U.S. exchange-listed Manufactured Housing REITs which collectively account for roughly $40 billion in market value: Equity Lifestyle (ELS), Sun Communities (SUI), UMH Properties (UMH). Additionally, newly-listed Flagship Communities (FLGMP) trades on the Toronto Stock exchange.

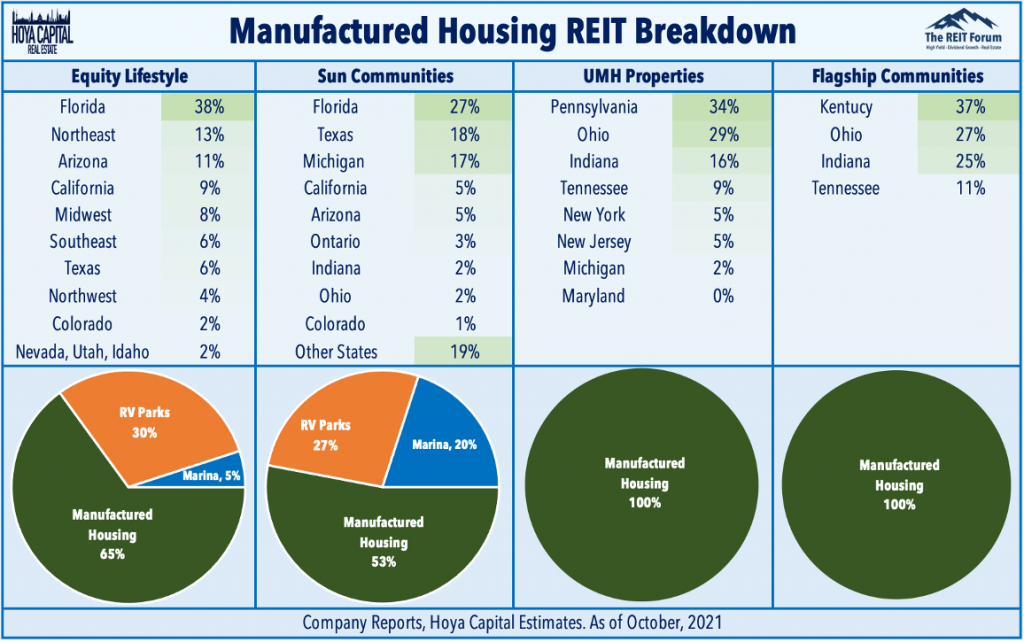
Manufactured Housing REITs collectively own roughly 350,000 manufactured housing and RV sites across the United States with a portfolio skewed toward higher-end communities with a more “retiree-oriented” demographic than the all-ages community. Through a series of acquisitions, Equity Lifestyle and Sun Communities have recently expanded into boat marinas as well while the smaller UMH Properties and newly-listed Flagship Communities focus on traditional manufactured housing communities.

Through a series of acquisitions, Equity Lifestyle and Sun Communities have recently expanded into boat marinas as well while the smaller UMH Properties and newly-listed Flagship Communities focus on traditional manufactured housing communities.

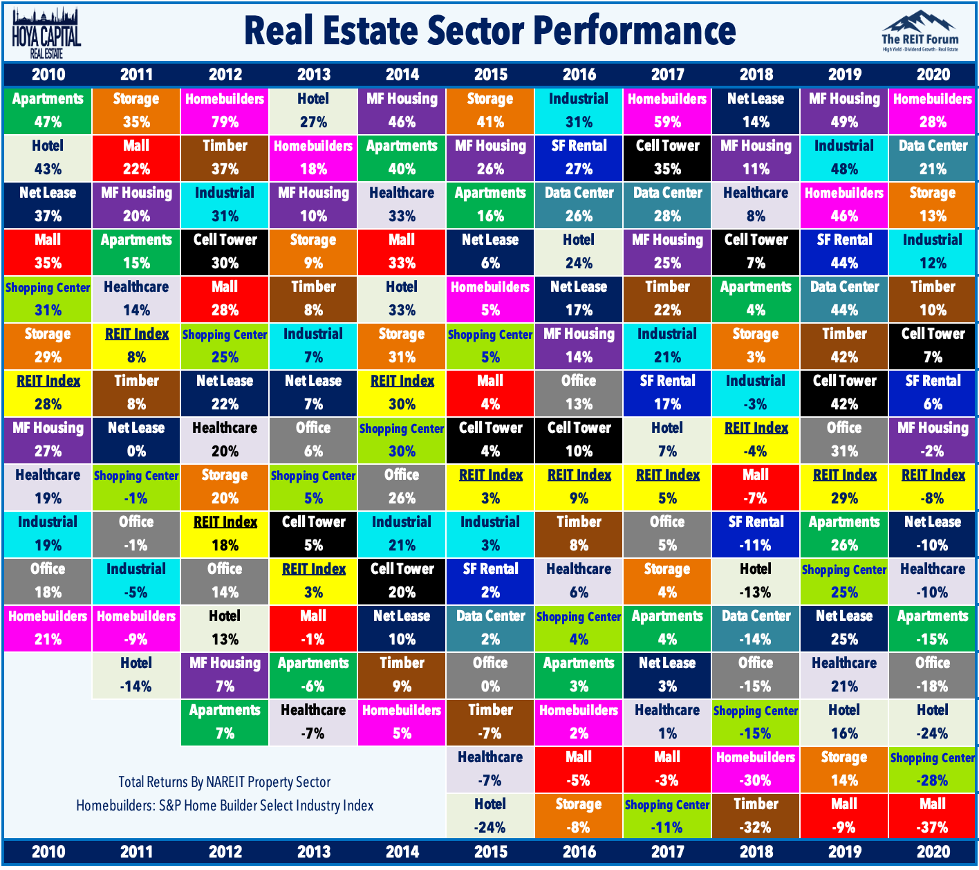
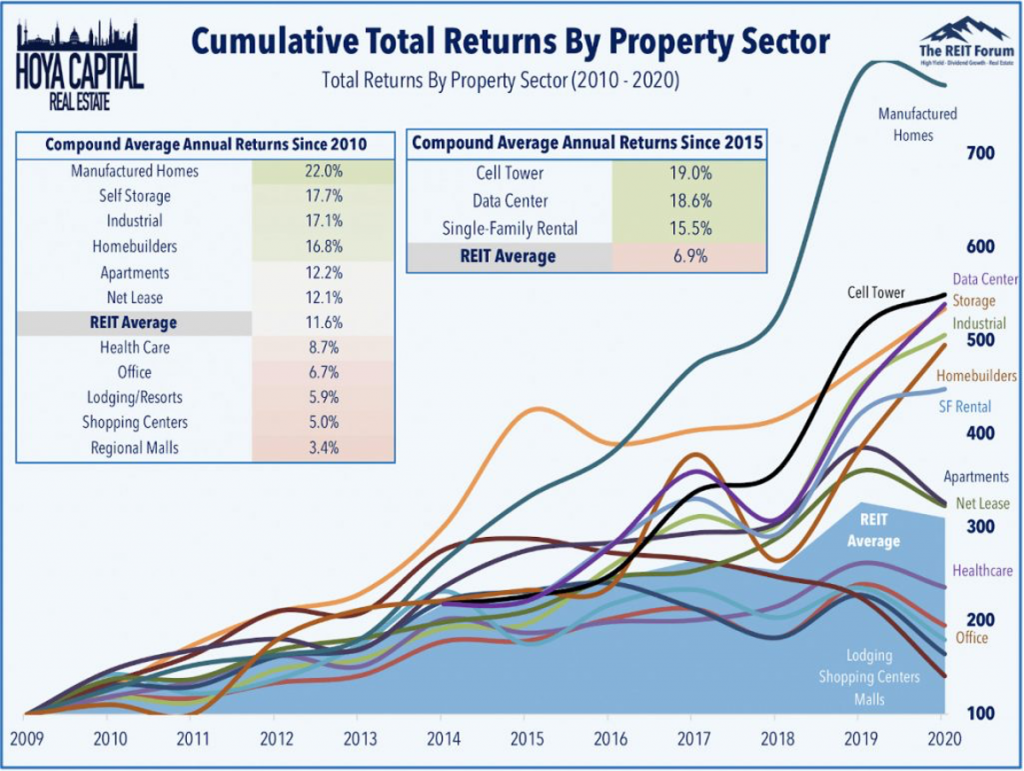
Manufactured housing REITs have emerged over the past decade from relative obscurity into several of the largest publicly-traded owners of real estate in the world. Beneficiaries of the lingering housing shortage across the United States resulting from a decade of underbuilding, manufactured housing REITs have been the single-best performing REIT sector since the start of 2010, delivering an incredible 22% annual compound total returns from 2010 through 2020.

Third Quarter 2021 MH REITs Performance

MH REITs soared nearly 15% in the weeks following their stellar second-quarter earnings reports – and were briefly the second-best-performing REIT sector on the year – but have given up some of these gains in recent weeks given the recent concerns over rising rates and inflation.

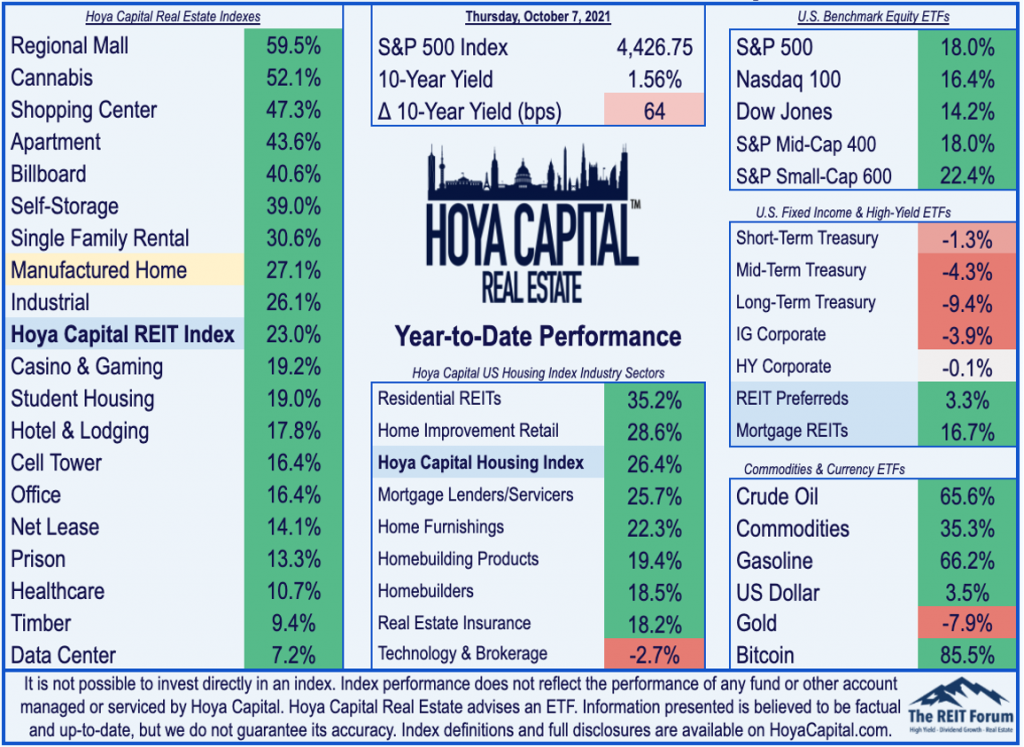
Despite the roughly 10% correction from recent highs set in early September, MH REITs are still higher by 27.1% this year, still outpacing the 23.0% gains from the market-cap-weighted Vanguard Real Estate ETF (VNQ), and beating the 18.0% returns from the S&P 500 (SPY) and 18.0% gains from the Mid-Cap 400 (MDY).

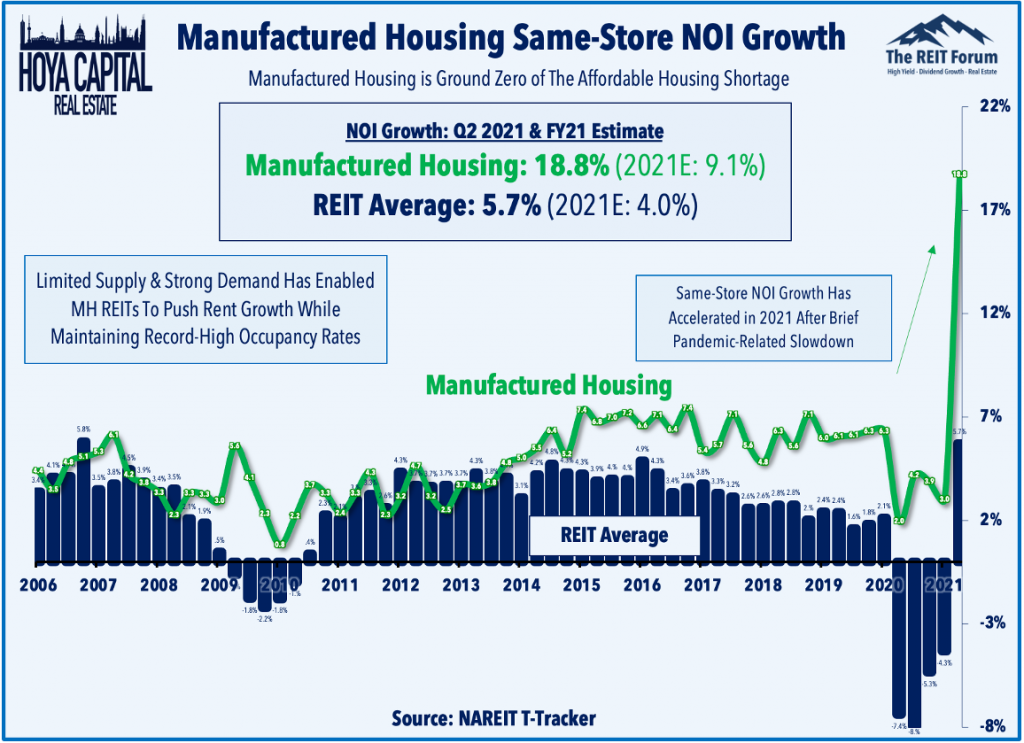
Consistent with the trends across the residential REIT industry over the past quarter, MH REITs significantly boosted their growth outlook over the last quarter, citing strong rental housing demand and substantial upward rent pressure. Same-store Net Operating Income (“NOI”) growth continues to accelerate following a brief pandemic-related slowdown as property-level growth is now expected to rise by more than 9% for full-year 2021, up from the prior outlook which called for roughly 6% NOI growth.

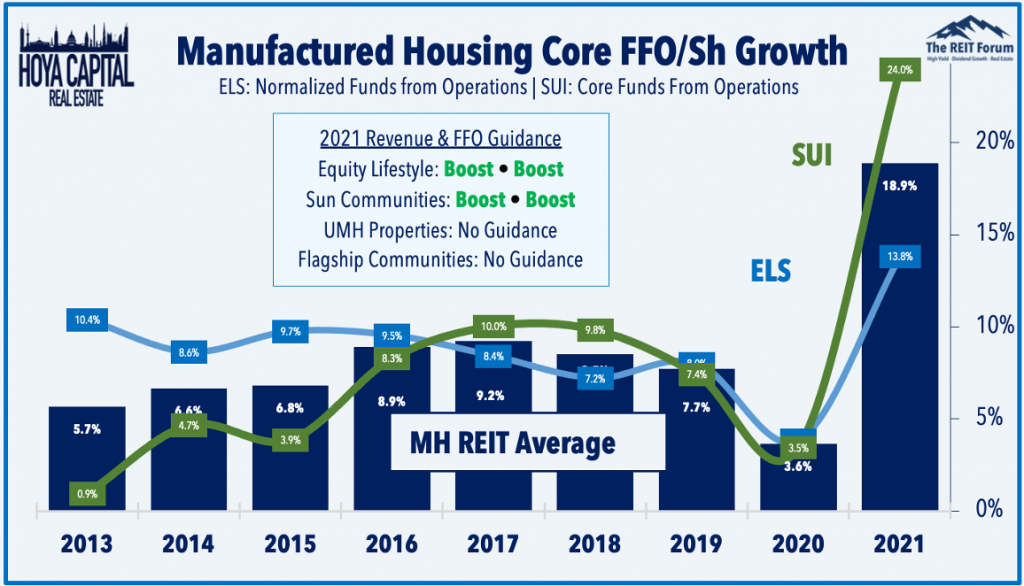
Growth in funds from operations – the earnings per share “equivalent” for REITs – is driven by the combination of same-store “organic” growth and by external growth through acquisitions and new development. Forward guidance over the past quarter was particularly impressive as ELS and SUI project growth in Funds From Operations (“FFO”) of nearly 19% this year – up from their prior outlook of 14% growth last quarter – which would surely be one of the strongest growth rates in the REIT sector.

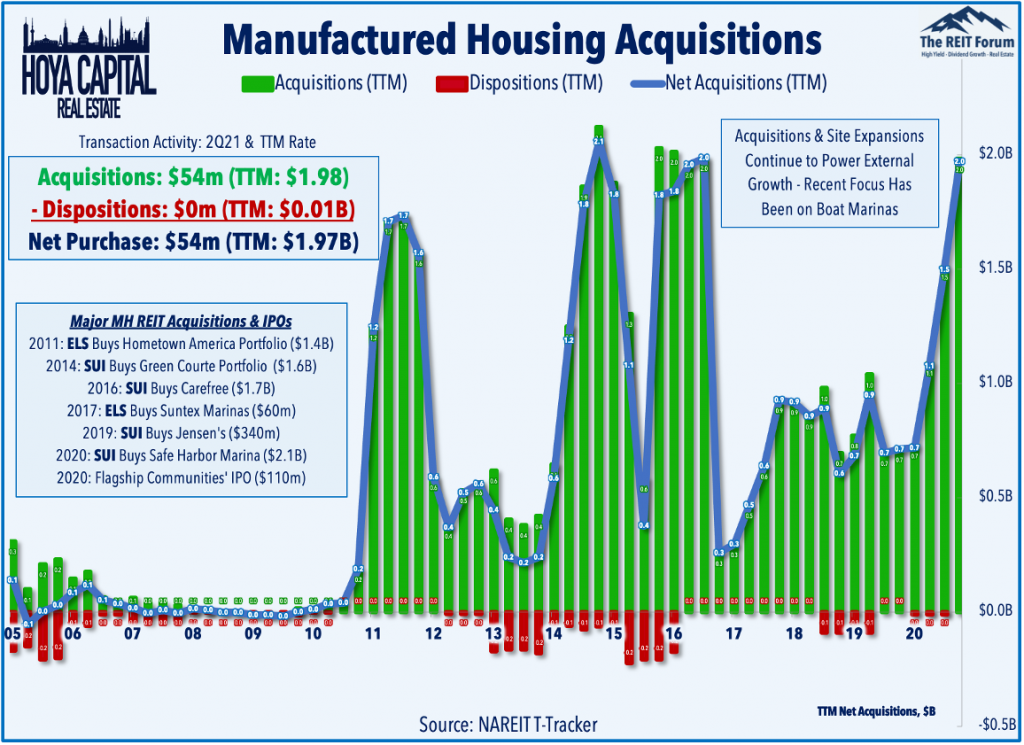
Utilizing a strong cost of equity capital, these REITs have continued to grow externally by adding units to existing sites and by growing via acquisitions and site expansions. MH REITs acquired just shy of $2 billion worth of properties over the last year, largely in one-off acquisitions while disposing of just $10 million in assets. The most significant deal in 2020 was Sun Communities’ $2.1B purchase of Safe Harbor Marinas, which owns and operates 101 institutional-quality boat marinas.

Manufactured Housing Industry Data Points

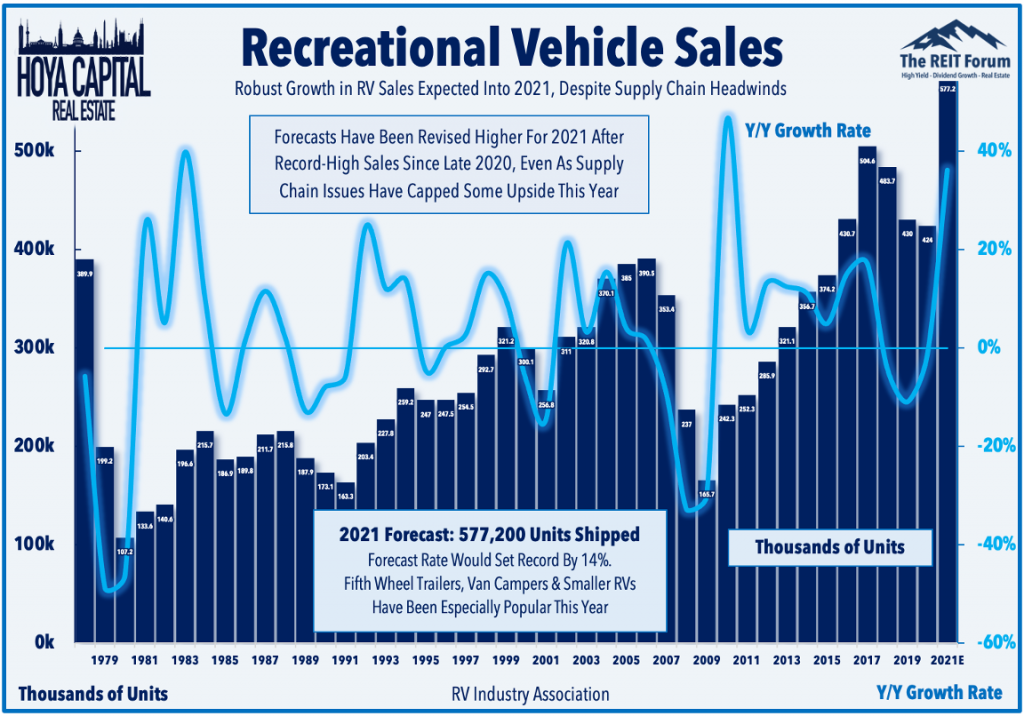
MH REITs’ amplified focus on analogous asset classes – RV parks and marinas – was perfectly-timed, providing an added external growth tailwind. “Work-From-Anywhere” has fueled soaring RV, boat, and vacation home sales. The RV Industry Association expects RV wholesale shipments to climb to their highest historical total ever. While the RV industry has faced similar supply chain issues as traditional homebuilders, the RVIA sees shipments rising to 577k units in 2021, which would be a 14.1% gain over the current comparable record high of 504,600 units in 2017.

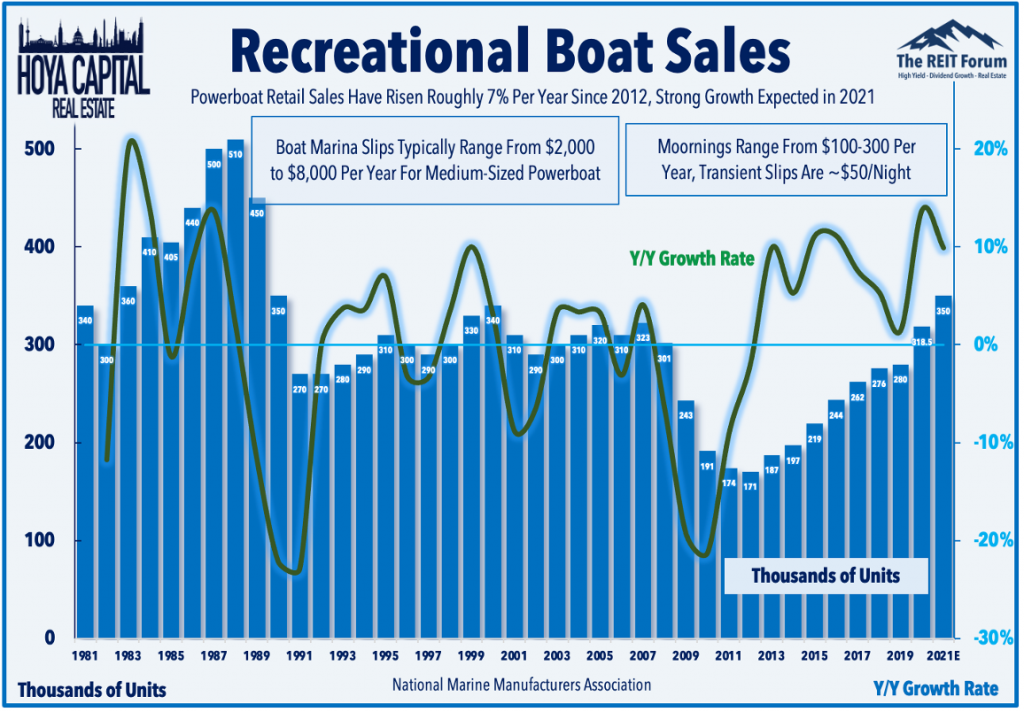
The National Marine Manufacturers Association, meanwhile, reported that powerboat sales are also poised to set record-highs this year despite inventory levels that are “the leanest they’ve ever been.” With SUI’s major investment in Safe Harbor Marinas, these MH REITs are now the two largest owners of marinas in the United States, an asset class with nearly identical fundamental characteristics as their large portfolio of RV parks. Marinas offer substantial operating parallels to the company’s RV business and that there are roughly 4,500 marinas in the US, of which 500 would be considered “institutional quality.” Earlier this year, ELS also expanded its marina portfolio with a purchase of 11 marinas, containing 3,986 slips, for $262.0 million.

MH REITs Key Takeaways

Low supply and strong demand have driven stellar fundamental performance for MH REITs over the past half-decade, and the MH sector continues to deliver sector-leading NOI and FFO growth. Consistent with the trends across the residential REIT sectors over the past quarter MH REITs significantly raised their growth outlook, citing strong rental housing demand and substantial upward rent pressure. Despite reporting stellar results throughout the year, manufactured housing REITs’ remarkable streak of eight straight years of outperformance over the REIT Index will come down to the wire in 2021 as the sector has been pressured over the past month by concerns over rising rates, inflation, and the broader rotation from growth into value.

“Beneficiaries of the lingering housing shortage – creating a compelling backdrop for companies across the housing industry – we believe that the recent pull-back could represent the long-awaited buying opportunity for these dividend growth champions.”

— Hoya Capital

MH Earnings Reports

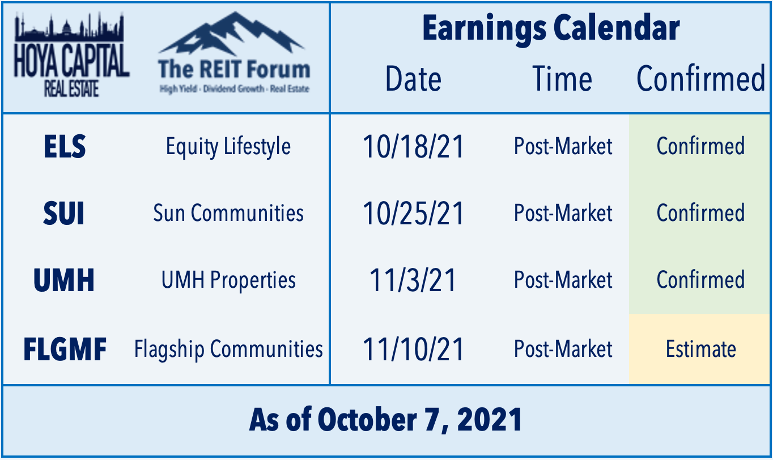
Looking ahead, MH REIT earnings season kicks off on Oct. 18 with results from Equity Lifestyle. Over the subsequent three weeks, we’ll hear results from Sun Communities, UMH Properties, and Flagship Communities, in that order.

MH REITs REPORT Terms Defined

FFO (Funds From Operations): The most commonly accepted and reported measure of REIT operating performance. Equal to a REIT’s net income, excluding gains or losses from sales of property and adding back real estate depreciation.

AFFO (Adjusted Funds From Operations): A non-standardized measurement of recurring/normalized FFO after deducting capital improvement funding and adjusting for “straight line” rents.

NOI (Net Operating Income): Typically reported on a “same-store” comparable basis, NOI is a calculation used to analyze the property-level profitability of real estate portfolios. NOI equals all revenue from the property, minus all reasonably necessary operating expenses.

Hoya Capital Disclosures

I am/we are long ELS and SUI. I am not receiving compensation for it. It is not possible to invest directly in an index. Index performance cited in this commentary does not reflect the performance of any fund or other account managed or serviced by Hoya Capital Real Estate. Nothing on this site nor any published commentary by Hoya Capital is intended to be investment, tax, or legal advice or an offer to buy or sell securities. Information presented is believed to be factual and up-to-date, but we do not guarantee its accuracy and should not be considered a complete discussion of all factors and risks. A complete discussion of important disclosures is available on our website www.HoyaCapital.com.


Bookmark MHInsider for the latest in manufactured housing news, and to keep up on all of the manufactured housing industry trends.

Datacomp Publishes JLT Land-Lease Community Data for Six Midwest States

countryside estates umh jlt market reports rent occupancy
Countryside Estates, Muncie, Ind. Photo courtesy of UMH Properties.

Datacomp has published its October 2021 JLT Reports for mobile home rent comps, occupancy, and other vital data from manufactured home communities in Illinois, Indiana, Kansas, Kentucky, Missouri, and Wisconsin.

JLT Market Reports provide detailed research and information on communities in 186 housing markets throughout the United States. These include the latest rent trends and statistics, marketing programs, and a variety of other useful management insights.

Datacomp maintains and provides the JLT Market Reports and is the nation’s #1 provider of market data for the manufactured housing industry. JLT Market Reports are recognized as the industry standard for manufactured home community market analysis.

The October 2021 manufactured housing market data published in JLT Market Reports for the six states include information from 13 markets on 245 “All ages” and “55+” manufactured home communities.

Altogether, the reports from the six states’ manufactured home communities include data representations for 34,326 homesites.

Regional Trends in Manufactured Housing Community Rent
  • Midwest region manufactured home communities show a year-over-year 2.6% increase in rent for retirement communities and a 3.2% increase for all-ages communities.
  • Midwest region manufactured home communities show a year-over-year 1.7% increase in occupancy for retirement communities and a 1.6% increase for all-ages communities.

“Manufactured home communities throughout the six states published in the JLT Market Reports for October 2021 showed impressive stability in average lot rent, as well as strong occupancy with all but one of the 13 markets showing overall growth,” Datacomp Co-President and Chief Business Development Officer Darren Krolewski said.

What’s in JLT Market Reports?

Each JLT manufactured home community rent and occupancy report from Datacomp has detailed information about investment-grade communities in the major markets. The detailed information includes:

  • Number of homesites
  • Occupancy rates
  • Average community rents, and increases
  • Community amenities
  • Vacant lots
  • Repossessed and inventory homes, and much more

JLT Market Reports also include management insights that rank communities by the number of homesites, occupancy rates, and highest to lowest rents. Established reports show trends in each market with a comparison of October 2021 rents and occupancy rates to October 2020, as well as a historical recap of rents and occupancy from 1996 to the present date in most markets.

The October 2021 JLT Market Reports for Illinois, Indiana, Kansas, Kentucky, Missouri, and Wisconsin manufactured home communities are available for purchase and immediate download online at the Datacomp JLT Market Report website, or they may be ordered by phone in electronic or printed editions at (800) 588-5426.

Each fully updated report for mobile home communities is a comprehensive look at investment-grade properties within a market, enabling owners and managers, lenders, appraisers, brokers, and other organizations to effectively benchmark those communities and make informed business decisions.

A Primer on the HUD Code

HUD Code Primer part I

Part I: The Manufactured Home Consensus Committee

By Devin Leary-Hanebrink

Leary-Hanebrink

This past January, HUD published its “third set” final rule amending the HUD Code. The effective date was originally March 15, 2021. However, in response to requests from several manufacturers struggling with delays caused by the COVID-19 pandemic, HUD agreed to postpone implementation. The new date, Monday, July 12, gave manufacturers and other stakeholders more time to navigate production backlogs and implement the required system updates necessary to comply with the new regulations.

While the final rule is important, perhaps a more fundamental question is: How is the HUD Code even updated?

For many manufactured home professionals — including more industry veterans than would probably care to admit — how the HUD Code is updated remains cloaked in a bit of mystery. After this two-part column, readers should better understand the HUD Code and the rulemaking process.

The Manufactured Home Construction and Safety Standards Act

Since 1974, when the National Manufactured Housing Construction and Safety Standards Act was signed into law — establishing a federal minimum standard for the industry — HUD has maintained jurisdiction over the construction, safety, and administrative rules for manufactured housing. Technically, the 1974 Act originally was titled the National Mobile Home Construction and Safety Standards Act, but was retroactively amended by the Housing and Community Development Act of 1980, which also replaced every instance of “mobile home” with “manufactured home”.

Decades later, the Manufactured Housing Improvement Act of 2000 substantially amended the 1974 Act. While the 2000 Improvement Act introduced several important updates, the creation of the Consensus Committee is critical to understanding how the HUD Code is amended.

The Manufactured Home Consensus Committee

The Consensus Committee — more commonly known as the Manufactured Home Consensus Committee or MHCC — is a federal advisory committee that provides recommendations to HUD regarding the adoption, revision, and interpretation of the manufactured housing construction and safety standards and the procedural and enforcement regulations (more commonly referred to as the HUD Code), among other responsibilities. It effectively replaced the 1974 Act’s National Manufactured Home Advisory Council.

The MHCC is composed of 21 HUD-appointed voting members, none of whom can be federal government employees, and one non-voting member who represents HUD. The Program Administrator for the Office of Manufactured Housing Programs is HUD’s Designated Federal Official. To promote diverse perspectives, voting members are divided into three groups

  • (i) Seven producers or retailers of manufactured housing (Producers)
  • (ii) Seven members who represent consumer interests, such as manufactured home residents or consumer organizations (Users)
  • (iii) Seven general interest and public official members (General Interest)

The Producers and Users are self-explanatory, and General Interest is less clear; while this group typically consists of representatives from the Primary Inspection Agencies and State Administrative Agencies, it can include other representatives, such as industry consultants and advisers. Further, to promote independence and prohibit collusion, the 2000 Improvement Act also introduced additional safeguards, including term limits, staggered terms, supermajority voting provisions, and a financial independence test and post-employment ban for some members.

The MHCC has established four subcommittees — the Regulatory Enforcement, Structure and Design, Technical Systems, and General Subcommittees — each responsible for different parts of the HUD Code. Proposals that require a more comprehensive review, such as technical changes to plumbing or electrical provisions, might be delegated to a subcommittee, which will then report back to the MHCC with recommendations.

Federal Oversight of Advisory Committees

Like all federal advisory committees, the MHCC is subject to several administrative and public access requirements, including the Administrative Procedure Act (APA) and the Federal Advisory Committee Act (FACA). For example, in accordance with the 1974 Act as amended and the FACA, HUD is required to convene the MHCC not less than once during each two-year period, publish in the Federal Register advance notice of each meeting, including advance notice of any subcommittee meeting, and hold all meetings open and available to the public, whether meeting in-person, virtually, or via conference line. The MHCC also is expected to operate in conformance with procedures established by the American National Standards Institute.

Additionally, all MHCC recommendations approved by HUD must go through the APA’s notice-and-comment rulemaking process to ensure the public has an opportunity to review and comment on the proposed changes before becoming law.

Part II: Amending the HUD Code

Given its component parts, the HUD Code is more comprehensive than the 1974 Act and more robust than a typical building code. Further, while it is true the 1974 Act has undergone few revisions since inception, the HUD Code is frequently updated — roughly a half-dozen times over the last decade alone.

Admittedly, not every update is a comprehensive revision. For example, roughly eight years span the time between publication of the “second set” and “third set” of HUD Code amendments. However, during that time, HUD and the MHCC updated the requirements for ground anchor installations, introduced Subpart M, amended the RV exemption, and revised the formaldehyde notice requirement. Most recently, with the “third set” final rule, manufactured housing officially transitioned to the 2021 HUD Code, which is more current than virtually any other contemporary building code or standard adopted by a U.S. jurisdiction.

Gathering Proposals to Update the HUD Code

Like any standard-setting organization (SSO), HUD is not only responsible for reviewing proposals to update the HUD Code but also for establishing the framework and cadence of review. Generally, an SSO will update its codes and standards every three, four, or five years. For example, the International Code Council updates its family of International Codes on a three-year cycle and the National Fire Protection Association updates its standards every three to five years. However, instead of a three, four, or five-year cycle, HUD has implemented a rather ambitious two-year plan.

Technically, there is no statute or regulation that specifies how frequently the HUD Code must be updated. The 1974 Act only requires HUD to convene the MHCC not less than once during each two-year period to consider revisions. HUD has interpreted this as requiring it to solicit and collect proposals for revising the HUD Code, and then assemble the MHCC as frequently as necessary, but no less than once every two years. However, unlike SSOs, which strictly adhere to their development cycles, just because HUD and the MHCC review proposals on a two-year cycle does not mean the HUD Code is amended every two years. Sometimes it is updated more — or less — frequently.

Preparing a Federal Register Notice to Update the HUD Code

After the close of a review cycle, the next step is assembling the MHCC. However, to ensure the public has ample opportunity to participate, HUD must publish advance notice of every MHCC meeting in the Federal Register. During these meetings, the MHCC will review outstanding proposals, approve, modify, or reject each one, and then prepare for HUD a report summarizing its recommendations.

HUD will review the MHCC’s recommendations and work with its Office of General Counsel (OGC) to develop them into a proposed rule for publication in the Federal Register. As part of this step, HUD is also responsible for ensuring the rule complies with several federal requirements, including the APA, Regulatory Flexibility Act, and the Paperwork Reduction Act. Further, the proposed rule must be reviewed by the Office of Management and Budget (OMB), the largest office within the Executive Office of the President. OMB will confirm that the proposal is consistent with the Administration’s broader policy directives. Given that HUD is a United States federal executive department and the HUD Secretary is nominated by the President, rarely — if ever — will a rule be published without OMB approval.

Once approved by OMB, the proposed rule is then published in the Federal Register and open for public comment, which usually runs for 30-60 days. After the window closes, HUD will review any comments received and, at its discretion, incorporate or reject them, with an explanation of its decision. HUD might even withdraw or abandon its efforts, as it did with its interpretive bulletin regarding frost-free foundations. Assuming HUD moves forward with its proposal, it will prepare a final rule for OMB review. After another round of approvals, the final rule will be published in the Federal Register with a future effective date for the new requirements.

The ‘Third Set’ Final Rule

HUD’s “third set” final rule illustrates the complexities of the regulatory change process. In January 2020, HUD published its proposed rule, which started the clock on a 60-day comment period. However, given that HUD’s “second set” final rule was published in late 2013, the “third set” proposed rule is actually the culmination of no fewer than six years of MHCC recommendations over three HUD Code review cycles.

HUD ultimately received over 40 public comments, which is a lot for a manufactured housing initiative (although, for perspective, it is not uncommon for other federal rulemaking initiatives to receive hundreds of comments). It then spent the next nine months reviewing these comments and coordinating with its OGC to develop a final rule that incorporated the public’s feedback. 

Next, HUD had to secure a second OMB approval to make sure everything was still aligned with the Administration’s objectives. Finally, on January 12, 2021, a year after publishing its proposed rule — and seven years since it published its “second set” final rule — HUD published its “third set” final rule. Six months later, on July 12, 2021, the final rule went into effect.

In conclusion, the HUD Code is not an antiquated system that trails behind other codes and standards in terms of safety and technical proficiency. Instead, amending it is a deliberately methodical process. By HUD’s own estimation, it takes 10 steps (and usually a few years) to get from an “initiating event” to publication of a final rule. Unfortunately, critics have latched onto this, turning it into a common refrain: the HUD Code is never updated. While it may not be updated as routinely as other codes and standards, inconsistency is not a proxy for inferiority.


Devin Leary-Hanebrink practices with McGlinchey Stafford PLLC. He helps clients navigate state and federal government agencies that regulate a wide range of industries, including banking, consumer financial services, housing, and construction. McGlinchey Stafford PLLC is a multi-service law firm with a national presence, serving clients from offices in Alabama, California, Florida, Louisiana, Massachusetts, Mississippi, New York, Ohio, Tennessee, Texas, and Washington, D.C.

There’s Still Time to Refi

low interest rate loans home community

Interest rates for everything from a home mortgage to the array of commercial property loans have remained very low through and coming out of the pandemic.

Most lenders and analysts surveyed in late summer by Bankrate said there continue to be opportunities for home and property owners to save money through restructuring a loan under current rates.

In the survey, 22% of Bankrate’s respondents said rates would go down, and 67% anticipated rates staying steady. And through the spring and summer with mortgages rates hovering around 3% and commercial loans roughly in a range of 3-7% depending on loan type, lenders report that about two-thirds of August business was in refinance, according to the Mortgage Bankers Association.

“It’s important to pause for a moment and recognize that monetary policy, with short-term interest rates set near zero, has effectively become looser as inflation has moved upward. In the past year, the consumer price index is up 5.3%, which means that a short-term interest rate target of 0.1% generates a ‘real’ (inflation-adjusted) interest rate of -5.2%.  By contrast, the lowest real short-term interest rate in 2020 was  -1.4% in March 2020… the lowest real rate in the aftermath of the Financial Crisis was -3.8%.”

— First Trust Advisors Chief Economist BrianWesbury

Commercial property owners who refinance often are motivated to take advantage of lower interest rates for a down payment on a new property, to reinvest and improve a property, or to have more cash in the bank.

Commercial Loan Types and Early September Rates
  • Bridge Rates : 4.12% – 13.12%
  • CMBS Rates : 3.04% – 4.60%
  • Construction Rates : 4.75% – 9.75%
  • Conventional Loan Rates: 2.12% – 6.29%
  • Insurance Rates : 2.78% – 5.58%
  • Mezzanine Rates : 4.54% – 9.10%
  • Private Banking Rates: 2.12% – 4.54%
  • SBA 7a Rates : 2.25% – 5.75%
  • SBA 504 Rates : 2.59% – 2.85%
  • USDA Rates : 3.25% – 6.25%

Economists point to the continued concern with the coronavirus, particularly the Delta variant, and its effect on the labor market. August numbers came back weaker than anticipated, suppressing any expectation the Fed may make a move to increase rates.

As the economy improves, and particularly if inflation takes hold, the Fed will begin to raise rates.

“We have said that we would continue our asset purchases at the current pace until we see substantial further progress toward our maximum employment and price stability goals, measured since last December, when we first articulated this guidance,” Chair of the Federal Reserve of the United States Jerome Powell said in August. “My view is that the “substantial further progress” test has been met for inflation. There has also been clear progress toward maximum employment.”


Bookmark MHInsider for the latest in manufactured housing news, and to keep up on all of the manufactured housing industry trends.
MH Advantage®-eligible Subdivisions Pave Way for Stronger Industry Growth

mh advantage-eligible homes clayton homes
Photo courtesy of Clayton Homes.

By Michael Dixon

Average U.S. home values have increased nearly 70% since 2011. While some segments of the economy struggled during the COVID-19 pandemic, increased demand continued to drive home prices up. Unfortunately, these trends put homeownership further out of reach for low- and moderate-income homebuyers who rely on affordable housing options to build equity and wealth.

It’s Fannie Mae’s mission to provide affordable housing opportunities across the country, and we recognize the critical role manufactured housing plays in fulfilling that mission. The high-quality, affordable housing segment is needed now more than ever before as rising prices put site-built homes out of reach for more and more borrowers.

Manufactured Homes Have Come A Long Way

In the decade between 2010 and 2020, shipments of manufactured homes have almost doubled in the United States. Despite that fact, manufactured homes represent only 6.3% of the nation’s housing stock, and 10.4% of new houses sold.

These numbers, while modest today, represent a great opportunity for growth. With aesthetic features like higher-pitched rooflines and low-profile foundations, durable siding materials, and high-end interior finishes, we can see great potential for incremental sales of today’s modern manufactured homes, which is why we launched MH Advantage® financing in 2018 to support this new and growing market.

MH Advantage financing is different from traditional manufactured home mortgages in several critical ways. Homebuyers purchasing eligible homes may qualify for home loans with as little as 3% down and lower interest rates than other manufactured home loan options. What’s more, if there aren’t other MH Advantage homes available as comparables, appraisers use the best available comparable home, which may include site-built homes.

With similar features and similar financing to site-built homes, MH Advantage-eligible homes are positioned to appeal to homebuyers who might not have considered manufactured homes before, growing market share and increasing sales of this home type. And new sales channels can help replicate the site-built buying experience as well.

MH Advantage-eligible Homes in Subdivisions

Picture a homebuyer driving down the road. She sees a sign advertising new homes and decides to go check it out. The homebuyer meets with a sales rep, who takes her on a tour of a model home, maybe several, and talks through all the customization options she can choose from.

This could describe someone visiting a manufactured home retailer, or it could describe someone visiting the sales office of a homebuilder starting a new community. The consumer experience in these two situations has a lot in common. And the end result, a brand new, high-quality, customized home permanently affixed to a plot of land, is the same as well.

But there are a number of big differences to consider. For example, a site-built home in a subdivision will often be more expensive and take longer to build than a manufactured home. It’ll be subject to weather delays and involve significantly more waste. And with material and labor costs skyrocketing, every bit of efficiency can make real impacts on the bottom line.

With MH Advantage-eligible homes maintaining aesthetic and durability features of site-built homes, they are an ideal fit for builders and developers to consider in their next subdivision model when looking to offer a more affordable product to customers without sacrificing the quality their customers expect. Industry stakeholders are already seeing some positive results as they begin to realize the value of including MH Advantage-eligible homes in subdivisions.

MH Advantage and CHOICEHome eligible home gray garage
An MH Advantage-eligible home. Photo courtesy of Fannie Mae.

Seeing Early Successes : High-Quality Housing to Meet Growing Demand

Strong economic activity in the surrounding regions has sparked an interest in Oroville, California, as an appealing, affordable destination for homeowners in recent years. While the Butte County city experienced a 10.7% population growth between 2010 and 2019, it reported a growth of 20% between August 2019 and August 2020. This city has a substantial need to quickly ramp up its affordable housing supply. 

A partnership between Skyline Champion Corporation and west-coast builder W&R will deliver 134 MH Advantage-eligible homes, with the first model units being installed in a new subdivision in 2021. These newly built MH Advantage-eligible homes are estimated to cost nearly $100,000 less than comparable existing site-built properties in the Oroville area, lending credence to the idea that newly constructed manufactured homes are cost-effective, without compromising on quality or aesthetics. 

Traditional Retailer Changes Business Model to Capture New Market

In the Cordell Oaks subdivision, located in Guadalupe County, Texas, the population continues to grow, and home prices continue to increase.  The metro area population of nearby San Antonio saw a 2.07% increase between 2020 and 2021, while the average sales prices for new and existing homes increased 5% during the 12 months ending July 2020. 

One of the home builders who developed this community chose MH Advantage-eligible homes to offer affordable housing with prices substantially below comparable homes in the area. The resulting Cordell Oaks subdivision features 21 one-acre lots, and it serves as the first full MH Advantage-eligible community in Texas. The home prices start at $201,995, while similar site-built homes on an acre of land are at a $300K price point in that area. 

The project is a result of the work of Spark Homes and Champion Home Builders.

Manufactured Homes are the Affordable Homes of the Future

Manufactured homes already provide an affordable source of housing to 22 million Americans. Still, as home prices increase and borrowers continue to be priced out of the site-built market, there remains a gap that manufactured housing is poised to fill. Particularly with MH Advantage-eligible homes, getting these high-quality products in front of consumers is the first critical step to breaking down mental barriers that stand between a buyer looking for a site-built home and considering a manufactured home.

MH Advantage-eligible subdivisions give consumers that opportunity to see manufactured homes with all of the must-have features and finishes in an affordable package in the same environment they’re used to seeing site-built homes. These subdivisions will help site-built homebuyers see that a manufactured home is a solution that puts the house that they want within their reach.


Michael Dixon is on Fannie Mae’s Environmental, Social and Governance team as part of Impact and Engagement. He manages the manufactured housing initiatives to support Fannie Mae’s Duty to Serve Plan.

SECO21 in Full Swing

The SECO National Conference of Community Owners Holds Virtual Meeting For Manufactured Housing Professionals

SECO21 is underway with hundreds of manufactured housing professionals attending and involved in a variety of educational and networking opportunities, including solo presentations, expert panels, mini-TED talks, fireside chats, and a cocktail hour.

During a session called Ready, Set, Grow: Developing and Expanding with Manufactured Housing, Scott Roberts, of Roberts Communities, led the audience through a session on the potential opportunity and common pitfalls in breaking new ground.

“We need more and more people to take the risk and develop new communities,” said Roberts, who has a large presence in Texas and the west.

But, Roberts warned, the development business is not for the faint of heart.

“It seems every time I’ve purchased a property I’ve been in a flood zone,” he said. “It gets very expensive.”

Roberts said developers of a new ground-up manufactured home community can expect to invest about 25% more than the original plan indicates, and that it can take as many as five years to begin making money on the property.

“Flatter is better. Don’t try to work against mother nature. And you have to be on a flat surface to make manufactured homes work they way they should,” he said.

Roberts said he prefers to develop in major metro areas with a population of 300,000 or greater, and preferably in a place with good job growth.

“I look for cities with expensive apartments,” Roberts said. “Your real competition at that point is the $200,000 home buyer.”

Roberts, a second-generation owner, said he’s built his track record with attractive, affordable communities and a winning presentation ready when he goes to talk with planning and zoning officials.

“We have no issued getting zoning,” Roberts said. “If more people do high-quality projects… the more communities you’ll get to create.”

Don Westphal, of Nadi Group, has consulted with Robert Communities on planning and design, and affirmed the approach toward answering all local questions and concerns on a new project from the outset.

“Don’t be caught flat-footed,” Westphal said. “Have answer to all of the questions… everyone is going to want to pick apart your plan.

“Presentation is what it’s all about,” he continued. “Exhibit in your presentation what the impact on the environment will be, and what steps you’re taking.”

Westphal emphasized building a team, explaining everyone’s qualifications, and preparing to talk with neighbors about specifics.

“Where will the entrance for the community be? It seems like a small thing, but it’s not. Is there a home across the street that can expect headlight through the wide each day as residents are coming or going?”


SECO21 is underway and continues through Oct. 1. Check back for updates from MHInsider, the leader in manufactured housing industry news, and bookmark our site for more news and information about manufactured housing industry events and conferences.

JLT Market Reports for Manufactured Home Communities in Calif., Okla., Texas Available

JLT Market Reports Oklahoma Manufactured Home Communities
Watson Estates in Chickasha, Okla.

Datacomp has made available its September 2021 JLT Reports for mobile home rent comps, occupancy, and other vital data from manufactured home communities in Oklahoma, California, and Texas.

JLT Market Reports provide detailed research and information on communities in 186 housing markets throughout the United States. These include the latest rent trends and statistics, marketing programs, and a variety of other useful management insights.

Datacomp maintains and provides the JLT Market Reports and is the nation’s #1 provider of market data for the manufactured housing industry. JLT Market Reports are recognized as the industry standard for manufactured home community market analysis.

September 2021 manufactured housing market data published in JLT Market Reports for the three states include information from 28 markets on 1,027 “All ages” and “55+” manufactured home communities.

Altogether, the reports from California, Texas, and Oklahoma manufactured home communities include data representations for 217,788  homesites.

Regional Trends in Manufactured Housing Community Rent

  • Pacific region manufactured home communities show a year-over-year 2.8% increase in lot rent and a 0.4% occupancy increase across 974 communities.
  • Southwest region manufactured home communities show a year-over-year 4.6% increase in lot rent for and a 0.7% occupancy increase across 510 communities.

“Rent and occupancy rates increased modestly through most markets in the three states’ JLT Market Reports updated and published in September 2021,” Datacomp Co-President and Chief Business Development Officer Darren Krolewski said. “Only one California market among retirement communities showed an above-average rent increase.”

What’s in JLT Market Reports?

Each JLT manufactured home community rent and occupancy report from Datacomp has detailed information about investment grade communities in the major markets. The detailed information includes:

  • Number of homesites
  • Occupancy rates
  • Average community rents, and increases
  • California rent control and next increase data
  • Community amenities
  • Vacant lots
  • Repossessed and inventory homes, and much more

JLT Market Reports also include management insights that rank communities by the number of homesites, occupancy rates, and highest to lowest rents. Established reports show trends in each market with a comparison of September 2021 rents and occupancy rates to September 2020, as well as a historical recap of rents and occupancy from 1996 to the present date in most markets.

The September 2021 JLT Market Reports for Texas, California, and Oklahoma manufactured home communities are available for purchase and immediate download online at the Datacomp JLT Market Report website, or they may be ordered by phone in electronic or printed editions at (800) 588-5426.

Each fully updated report for mobile home communities is a comprehensive look at investment grade properties within a market, enabling owners and managers, lenders, appraisers, brokers, and other organizations to effectively benchmark those communities and make informed business decisions.

The Promise of a New Model with a Rich History

augusta communities nonprofit california

Augusta Communities is Unique Among Industry Nonprofits 

Manufactured home communities have been a hot commodity for owners and investors for years now, and with much of the consolidation having occurred it’s often said to be a difficult market for buyers. There are too few communities to choose from, prices are high, and you’re competing against a lot of other potential buyers.

For Suzanne Taylor and her team at Augusta Communities, a 501(c) 3 affordable housing organization, the challenge is all the more real.

“Augusta is competing with for-profit investors who have larger organizations, plenty of access to capital and offer a very quick close. For-profits can take on more investment risk. The motives of most for-profit owners are different than ours. Our central goal is to maintain housing affordability for our residents and to improve their community,” Taylor said. “In the nonprofit model there’s no distribution of cash flow, it goes back into our efforts to build the community and fund future acquisitions.”

The nonprofit model was born out of thoughtful negotiations with Southern California municipalities more than 20 years ago at a time when residents were reaching out to their city officials for assistance in maintaining housing affordability. Since that time, Augusta has acquired six communities of its own and manages parks for local municipalities. 

“Augusta’s nonprofit model was developed as a way to work with municipalities to fund these acquisitions because they can issue tax-exempt bonds with favorable interest rates and 100% financing or more,” Taylor said. “That allowed us to be more mission-driven in general, putting the residents’ needs first in all of our communities. 

Augusta’s financing options have expanded beyond bond financing. In early summer it closed on a $15 million Duty-to-Serve Fannie Mae loan.

The nonprofit model allows Taylor and her all-women-led management team — Accounting and Finance Director Chrissy Summerville, Business Development Director Erica Taylor, and Director of Community Services Vanessa Hatch — to make common area improvements, upgrade utilities, renovate or replace homes, and offer a robust resident services program.

Resident programs within the communities include…

  • Financial assistance
  • Vaccination clinics
  • Summer camps
  • College scholarships
  • Free tax prep
  • Homework clubs
  • English language programs
  • Health fairs
  • Good neighbor awards, and more

Erica Taylor, Suzanne’s daughter, calls the effort a “full-time community improvement project”.

“It is important to have a relationship with residents and continue to work to preserve manufactured home parks as affordable housing,” Erica Taylor said. “We always are working hard to make our communities a better place to call home. Our residents really like living here and we want to give as much back as we can. We meet and confer with our residents and reinvest project revenues back into our communities.”

Augusta’s model differs from the resident-owned community model.  In a resident-owned community, the park is operated by a constituency of residents who serve on a governing board that oversees the operation from a legal and financial perspective, and can advise on mission-driven operations. Augusta is overseen by a volunteer board and managed by third-party professional management groups that specialize in manufactured housing.  

“It’s so technical, how you manage your property, with rents, human resources, how you participate in government-sponsored improvement projects. It’s hard,” Suzanne Taylor said. “Our residents are pleased that they don’t have to manage each others’ space. They rely on our team and our board.”

Augusta must comply with government-imposed financial and affordability regulations that guaranty long-term housing affordability.  These regulations require  Augusta Communities to maintain at a minimum 20% of each of its parks for low-income housing, but overlaying agreements bump that requirement much higher to nearly 90@ in some projects.

‘Gateway to the Sequoias’

A somewhat recent acquisition for Augusta Communities has been rebranded from Mooney Grove to Rancho Robles, a community in Visalia, about 45 miles south of Fresno.

“It’s a beautiful place with all of the services that make a great city,” Erica Taylor said. “Everyone in the community is really happy, and proud of what we’ve been able to do there, and we are too.

“We have renovated the clubhouse, moved the office from clubhouse to a new model home, gated the entrances and added solar street lighting, installed new signage with its new name and branding, renovated older homes, installed new home, applied for the gas conversion program, and have begun offering resident service programs,” Erica Taylor said.

The replacement of homes has been aided by partnerships with other nonprofits, a blessing for an organization that lacks access to capital many for-profit organizations are finding from Wall Street and elsewhere.

She said even with all of the recent changes at Rancho Robles, there are 30 cleared and ready sites awaiting new homes. Those new homes will be paid for by capital made available by the refinancing of other communities, which is one way the nonprofit housing organization expands its efforts.

“We help individuals solve problems,” Suzanne Taylor said. “We work very hard to have strong relationships with our residents as well as our investors and our regulatory and funding partners.  

All of Augusta’s communities are in California, but the organization may move beyond the state in the coming months and years.

“We don’t have any real geographic limitations from here,” Erica Taylor said. “Ideally, we’re looking to go from Texas west.”

HUD Single Family Note Sale Nov. 10 Emphasizes Nonprofit Participation

HUD building in DC

Competitive bid sale provide priority bidding to non-profit organizations, units of state and local government

The U.S. Department of Housing and Urban Development’s Office of Asset Sales will conduct a competitive bid HUD-held vacant note sale (HVLS 2022-1) on Nov. 10, 2021.

The sale will include approximately 1,730 reverse mortgage notes secured by properties where the borrower is deceased and not survived by a non-borrowing spouse. Consistent with the Biden-Harris Administration’s Sept. 1 announcement that more HUD-owned properties should be returned to future owner-occupancy, HUD will offer up to 50% of the notes in the multi-loan pools for bids first by eligible non-profit organizations and units of state and local government. Previous sales prioritized approximately 10% of the mortgage notes for this purpose.

“This sale provides greater opportunities for non-profits and local governments to purchase properties that can then be made available for affordable homeownership and support neighborhood revitalization,” said Principal Deputy Assistant Secretary for Housing Lopa P. Kolluri.

The sale seeks to increase affordable housing supply, expand opportunities for homeownership and rental housing, and revitalize communities through the disposition of these notes, including:

Selling properties to low- to moderate-income homebuyers at a price affordable to households earning less than 120% of the Area Median Family Income; and

Leasing properties at rents affordable to households earning less than or equal to 80% of the Area Median Family Income.

To encourage more non-profit organizations and local governments to participate in this and future sales, HUD is hosting a virtual training conference for such organizations on Sept. 29. The conference, “Expanded Opportunities for Participation,” will include presentations on the note sale process, technical considerations, and an overview of the mortgage notes and processes for the November sale.

HUD’s Office of Asset Sales is part of the Office of Finance and Budget in HUD’s Office of Housing. All mortgage notes to be sold through the Nov. 10 sale are for vacant and abandoned properties secured by Home Equity Conversion Mortgages assigned to HUD following the death of the borrower and any non-borrowing spouse where the time for heirs to come forward has elapsed. 

EVENTS

Hall Awaits 2025 Class

In August, the RV/MH Hall of Fame will celebrate the 2025 class of inductees, five from each industry. “Our selection committees held meetings to review...
new manufactured home trade show the biloxi show 2025

The Biloxi Show Takes Center Stage

The Biloxi Manufactured Housing Show and Expo is now in its fourth year, and has cemented itself as a primary attraction for industry professionals...
manufactured housing the louisville show interior walk-in franklin shower bath mhinsider mhvillage

Everyone is Talking About The Louisville Show

‘a bath by Franklin that truly stole the show’ As someone who hasn’t attended the Louisville Housing Show for a few years, being there this...